FieldTwin Report
With FieldTwin Report you can;
- Make faster decisions with clear, reliable data
- See your entire field from seabed to topside
- Build custom reports in minutes
- Link data from all your tools
- See relationships between systems and assets
- Track field updates as they happen
See the video below for an overview
Release Notes
The latest release notes for version 1.0 released on TBA.
Installation
To enable the FieldTwin Report on your tenant, please contact your FutureOn Customer Success representative.
Navigation
Integration settings - Report integration settings can be found in Admin under the Integrations tab on the grey left-hand panel. Report settings are under Modules.
Template configuration - Report template uploads and configuration are managed in the Report tab found on the grey left-hand panel of the Admin page.

Report build - You can launch the report build window by clicking the Report button on the black panel on the left-hand side of the Dashboard.
Creating Report Templates
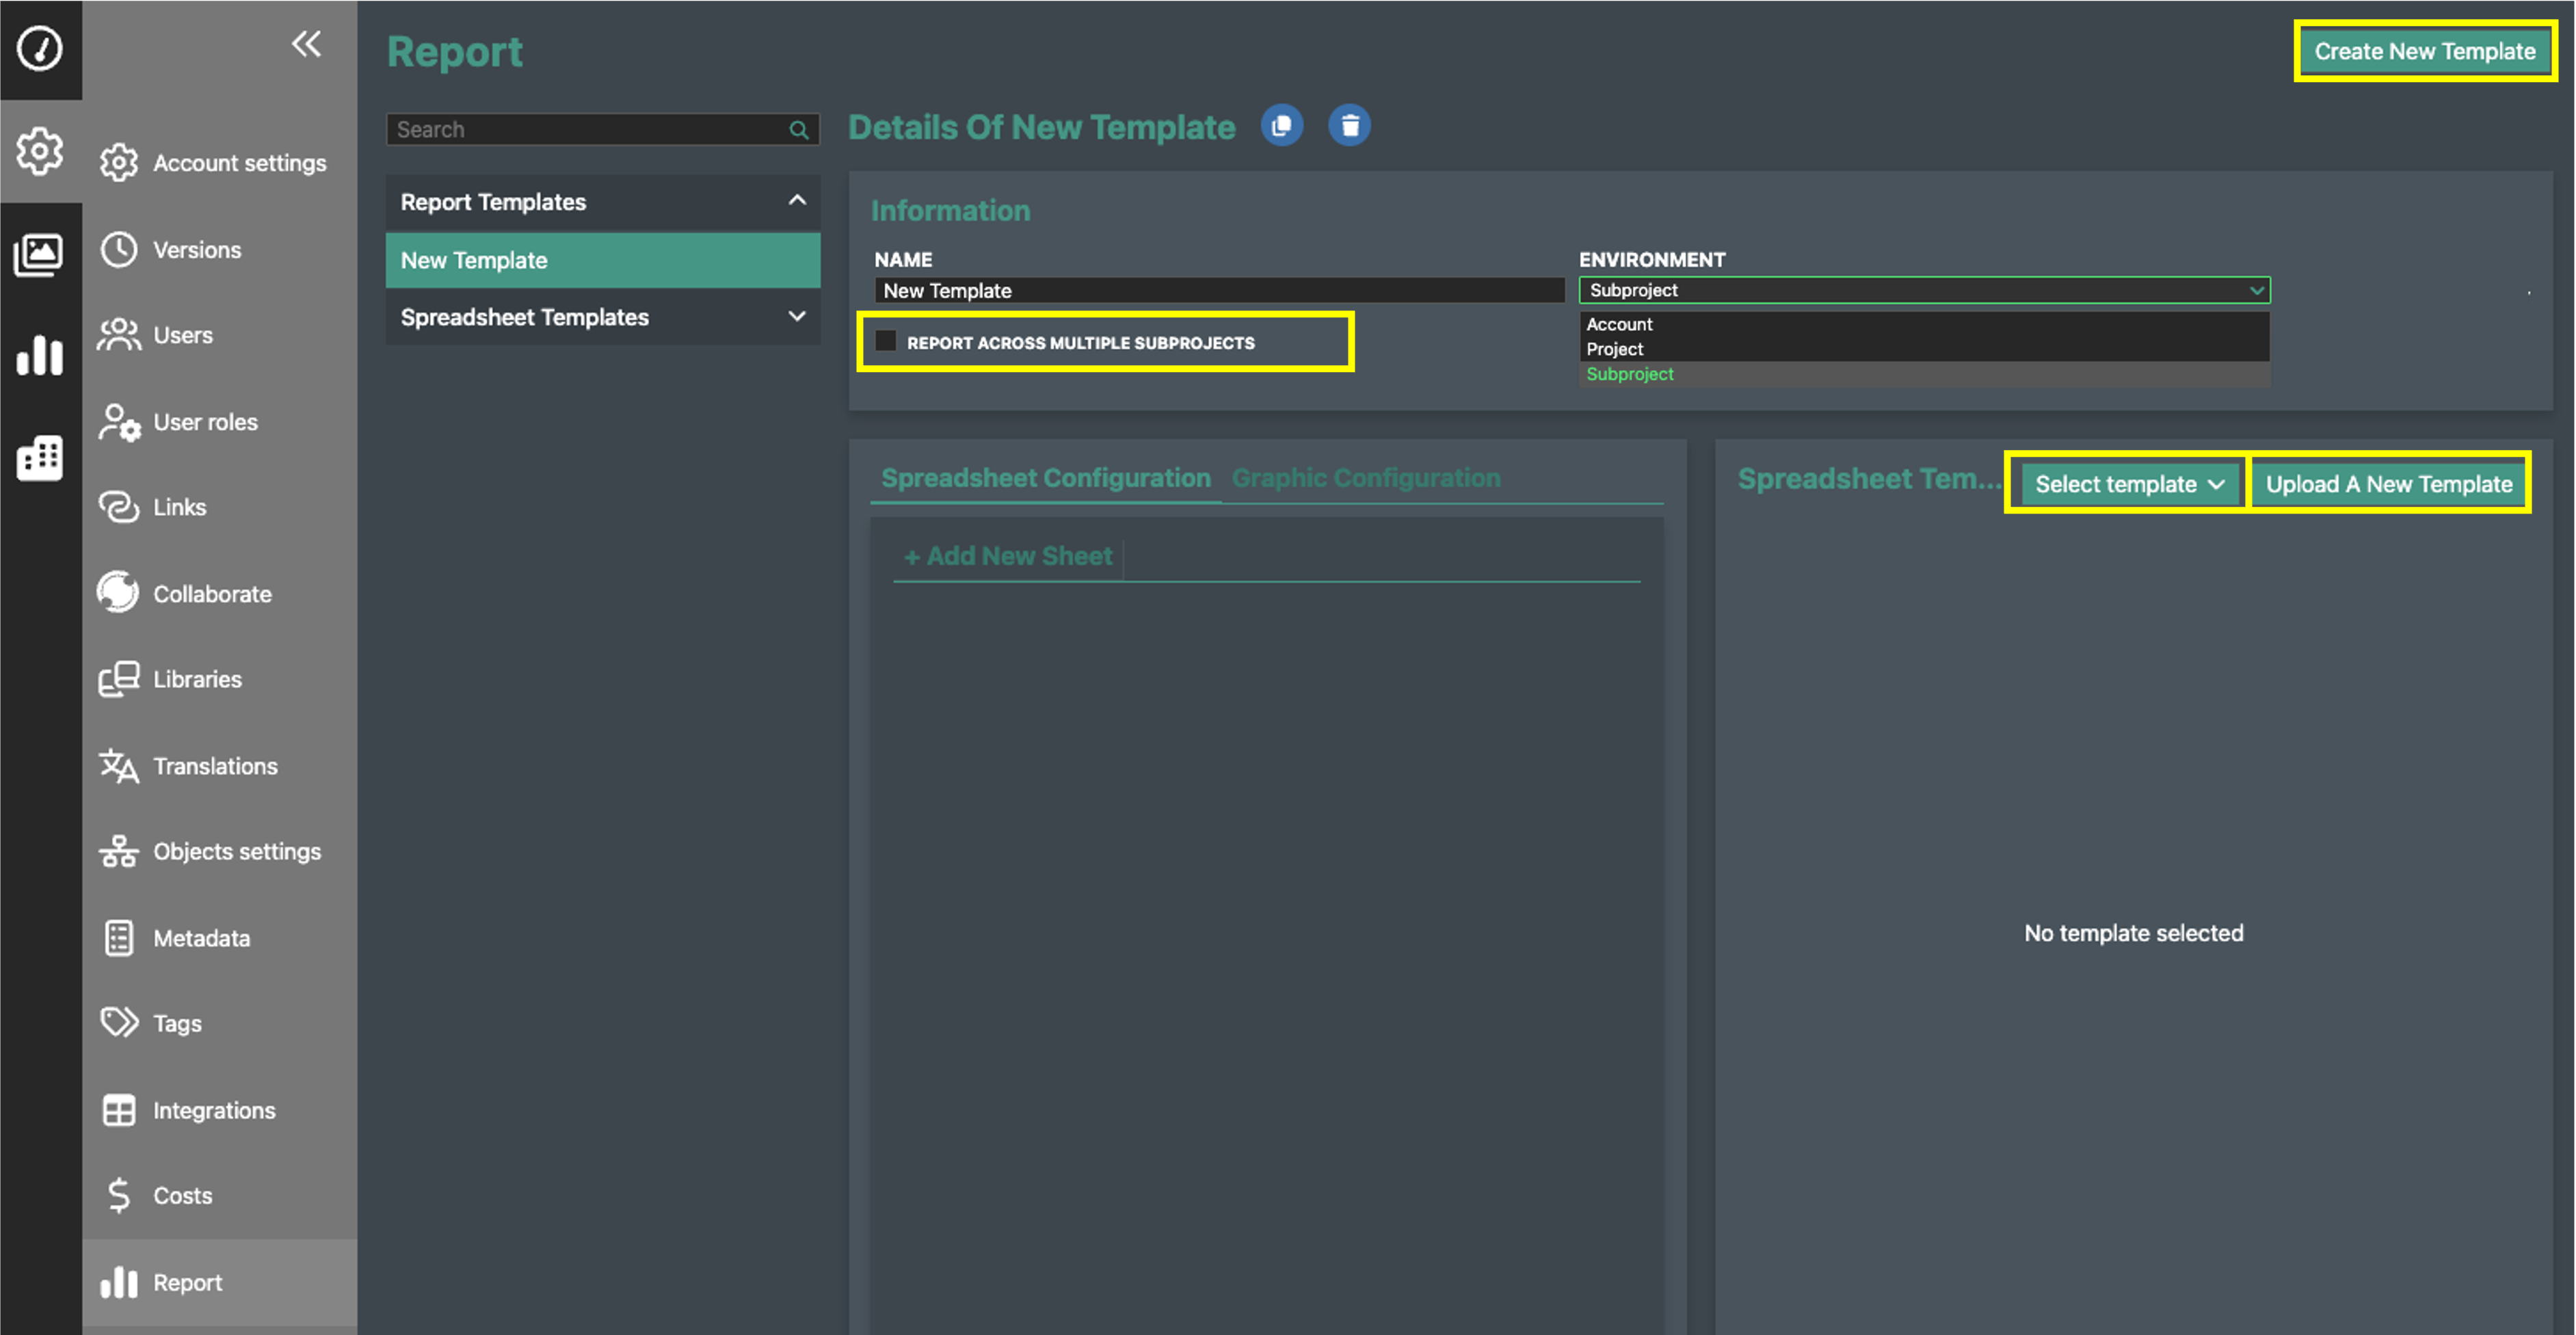
Create a Template - In the Report template configuration window, click the Create New Template button on the top right. New templates will be listed in the left-hand panel under Report Templates.
You can rename the template in the Name field, and use the copy icon to clone the template. Clone and delete buttons are shown as blue icons at the top of the window.
Delete a Template - Click the delete icon to delete a template. You cannot delete a template if it is linked to a generated report. You will first need to delete all linked reports in the Report Details window, explained in the Building a New Report section of the documentation.
Template Environment - Set the environment of the template using the drop down to either:
- Account - Query account information on account, users and workflow tasks.
- Project - Query project information such as project name and member details.
- Subproject - Query data at a subproject level such as asset and connections data.
Note - The environment field cannot be modified if a report template is linked to one or more reports.
Report Across Multiple Subprojects - Check the Report Across Multiple Subprojects option if you want to build a report that can query across multiple sub-project.
Upload a Spreadsheet Template
Use the Upload a New Template button to upload an excel spreadsheet template. Uploaded templates utilised by a report will be listed in the left-hand panel under Spreadsheet Templates.
- Only excel format is supported.
- Spreadsheets can have multiple sheets.
- Spreadsheets can contain text, empty cells and equations.
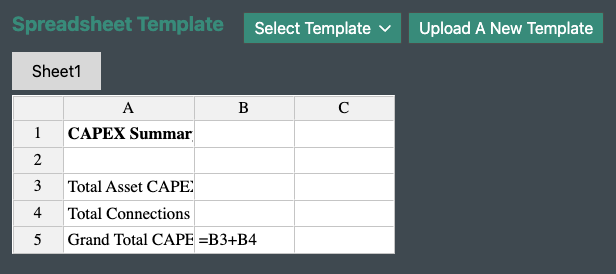
- Equations contained in the spreadsheet will be applied to the report. For example if cell B5 contains the equation =B3+B4, values in cells B3 and B4 of the report will be summed and the resulting value shown in cell B5 in the outputed report. Equations contained in the template will be shown in the template preview, for example:
If all reports are deleted that are linked to a certain template, that template will then be deleted and you'll need to re-upload if you want to use it again.
Changing Templates - You can change the excel template being used by either uploading a new template or by selecting a previously used excel template using the Select Template drop down.
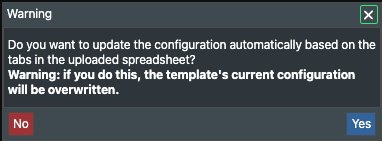
A pop-up will appear asking if you want to overwrite the existing row configurations. Click No to keep the existing configurations. Click Yes to overwrite and therefore remove all existing configurations.
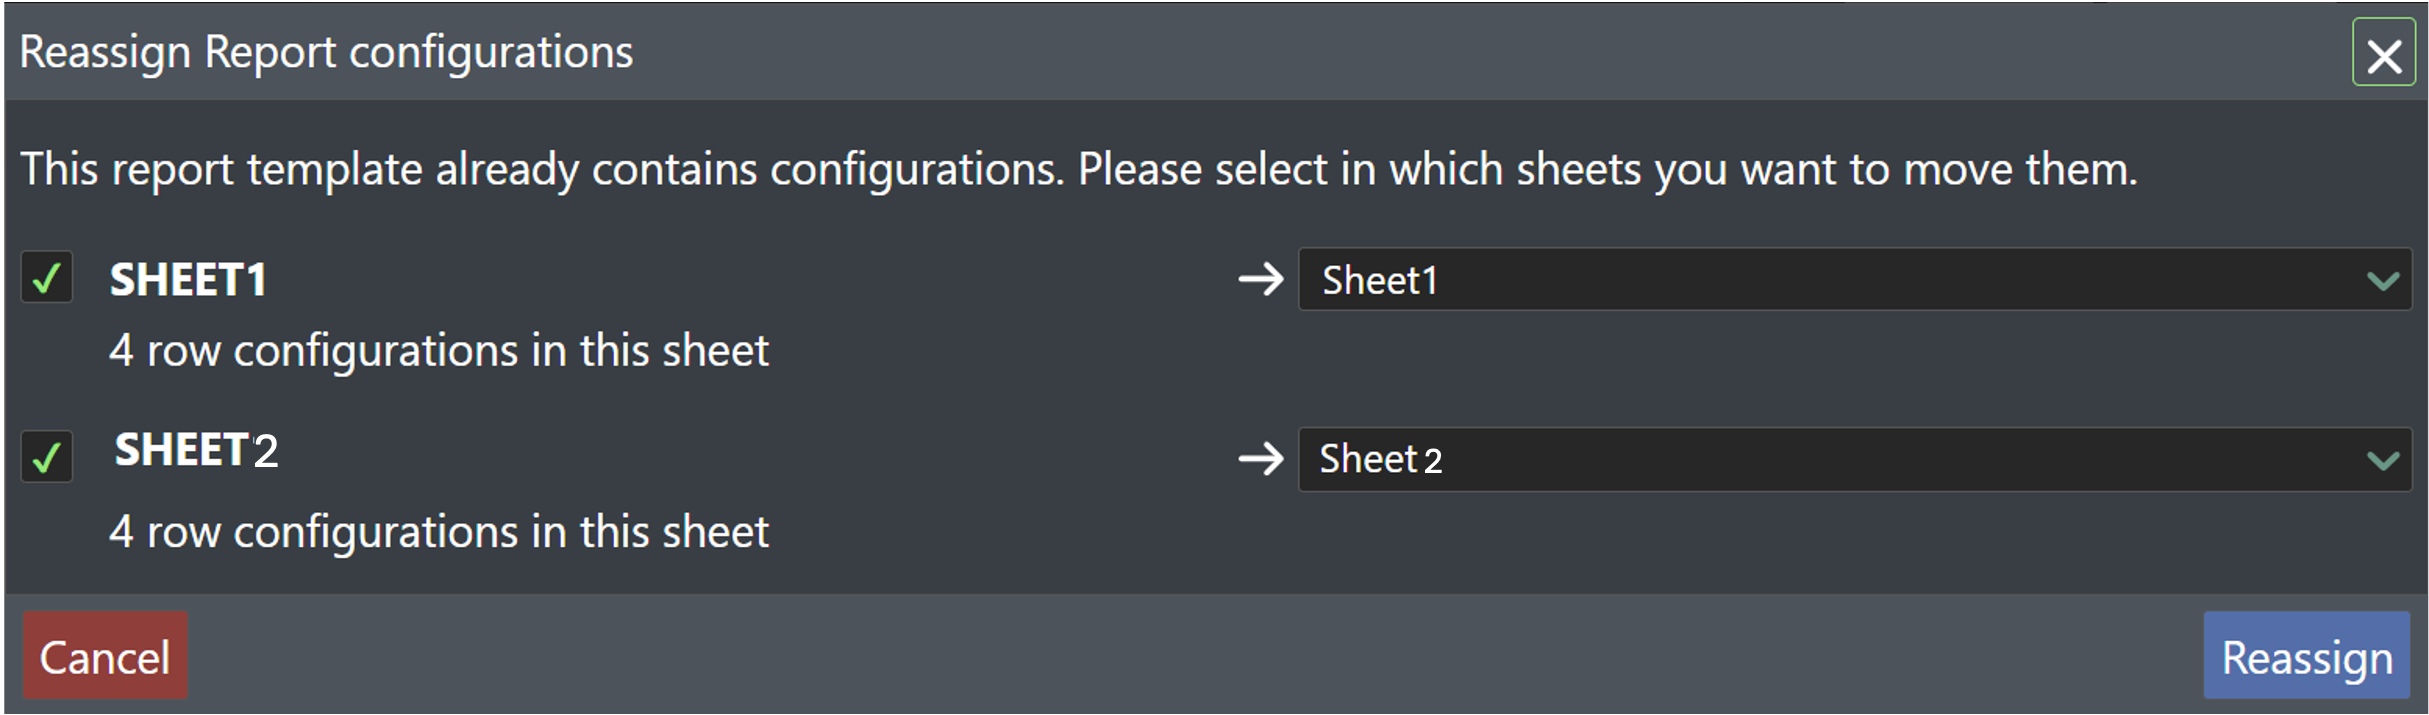
If you click Yes, and the new excel template has a different sheet configuration to the template currently in use (i.e. a different number of tabs or sheets named differently), a pop up will appear to allow you to choose how to reassign these sheet configurations.
Template Preview - Once a spreadsheet is uploaded or selected, it will show in the preview panel on the right-hand side. You can select different sheets using the tabs at the top to see sheet previews. Sheets can be renamed, deleted or added in the Spreadsheet Configuration panel on the left.
Spreadsheet Configuration
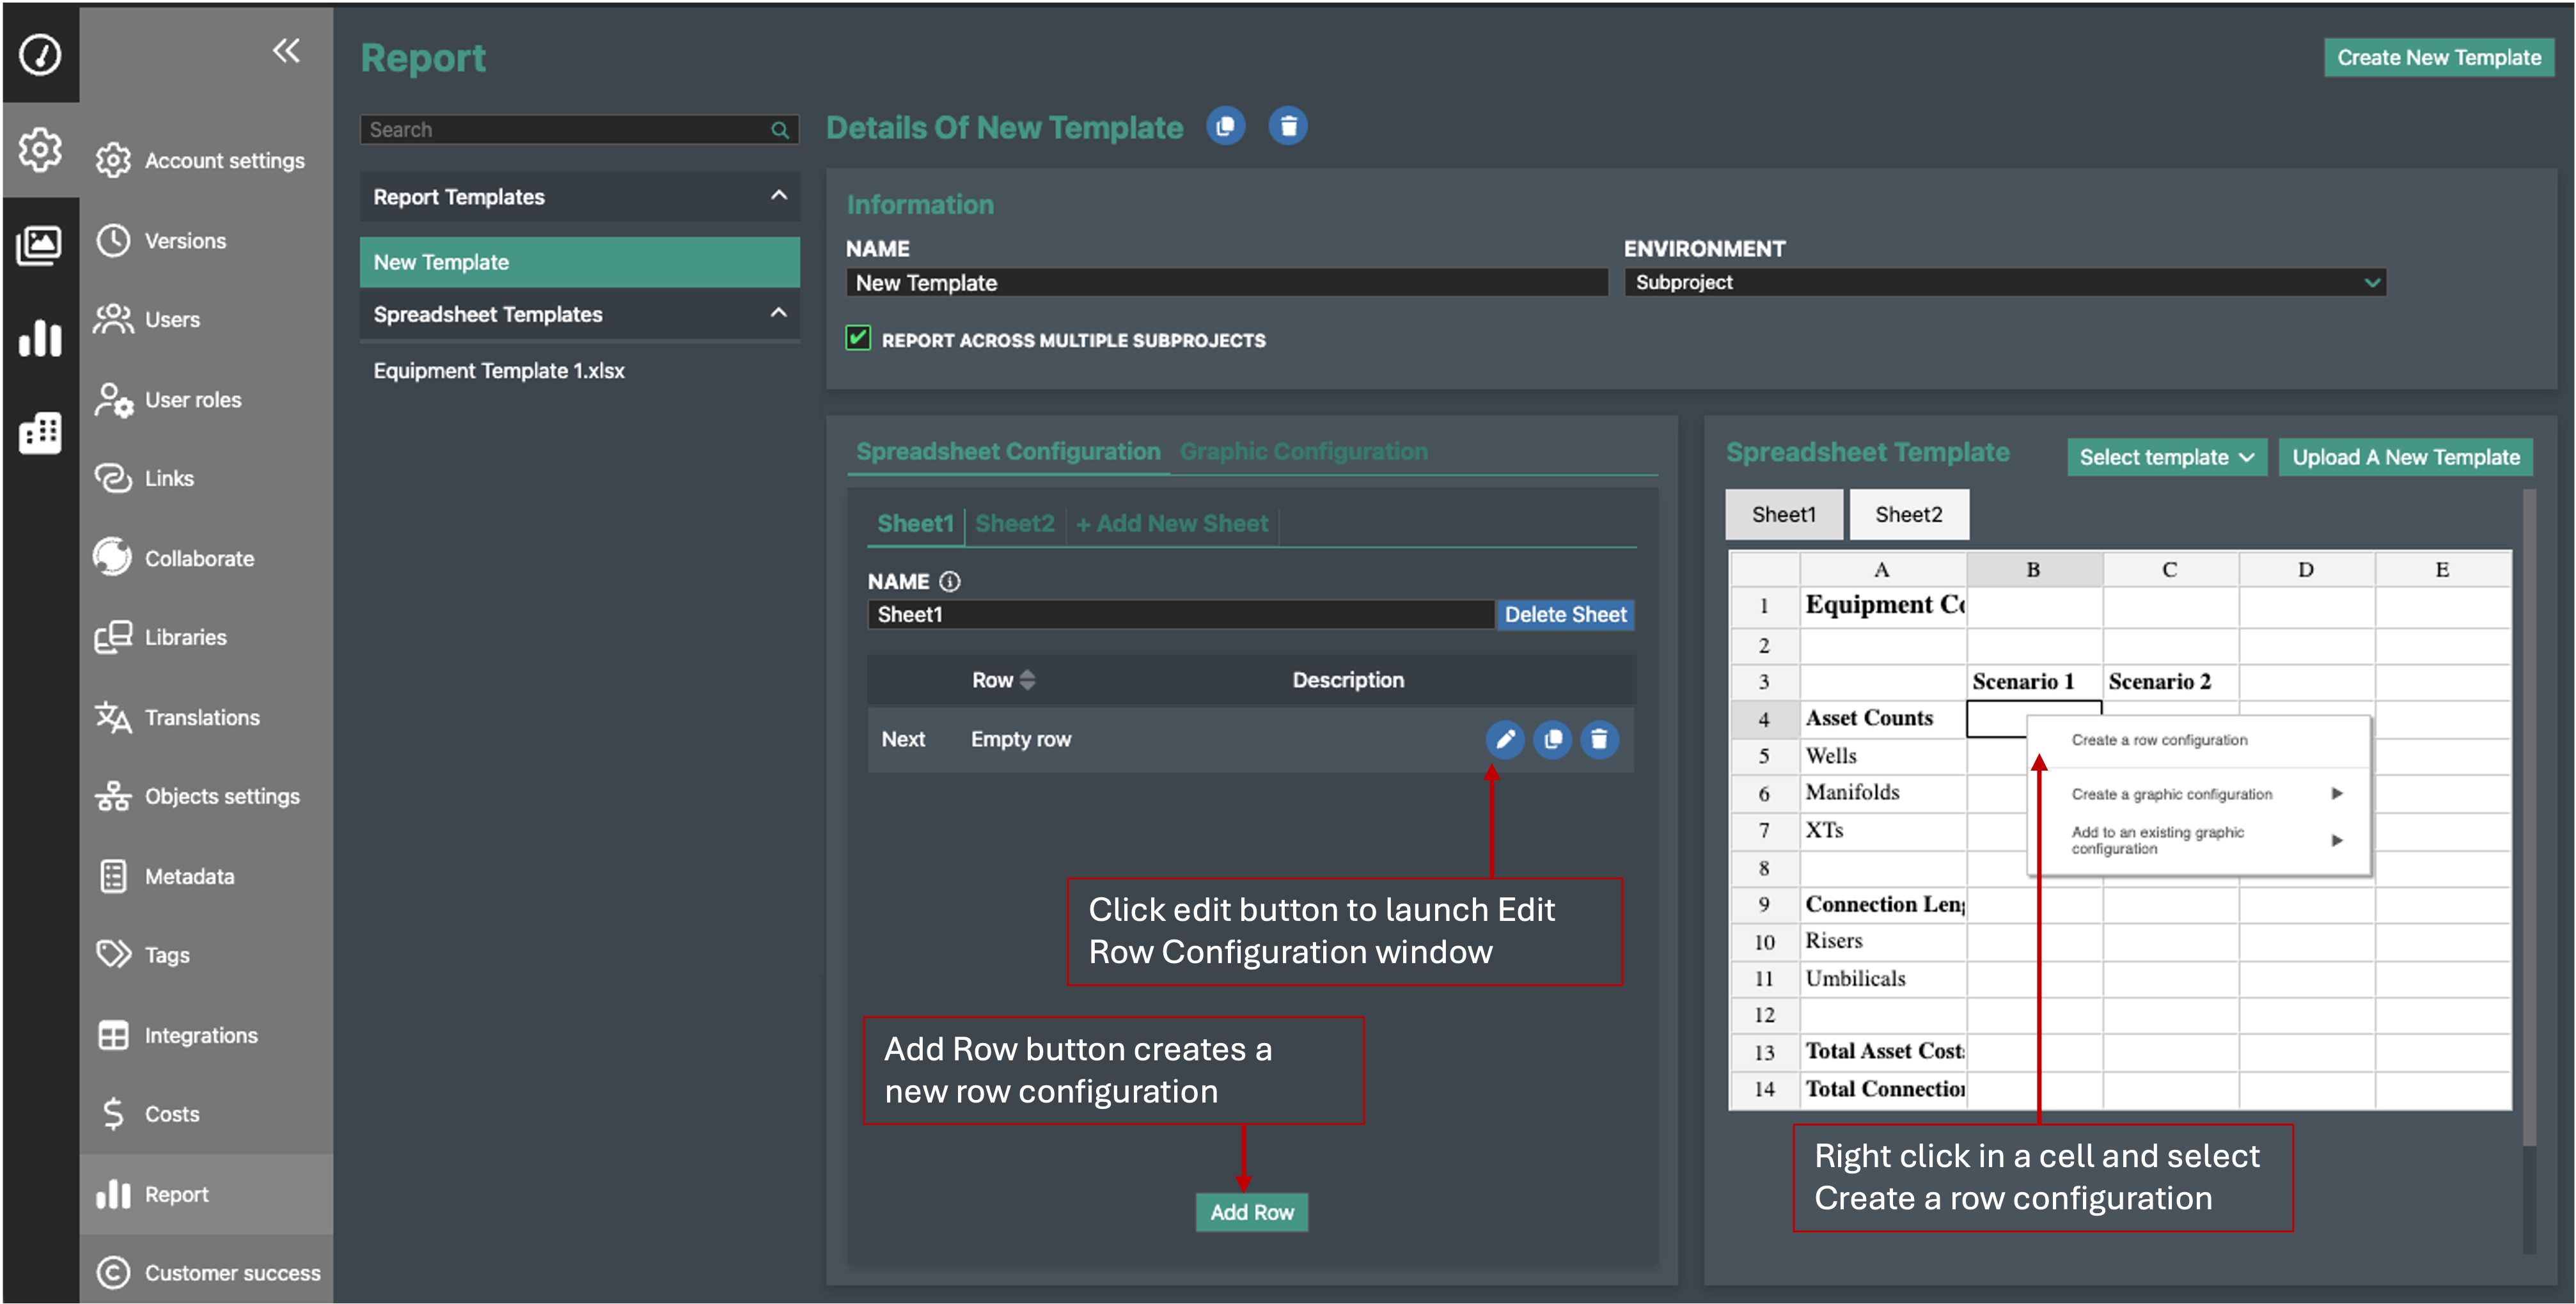
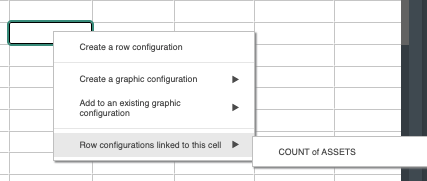
Create a New Report Output - Report calculations and outputs are referred to as row configurations in the Report settings interface. To create a new Configuration, right click in the cell in the template where you want the output to appear in the report.
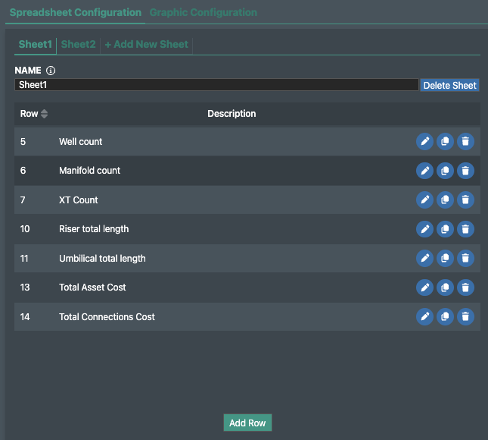
You can also click the Add Row button in the Spreadsheet Configuration tab which will show as empty row. Then select the edit button to the right. Configurations will be listed here and can be cloned or deleted using the buttons on each row. Cells linked to row configurations will be highlighted with a green cell outline. You can right-click on the cell to go directly to the corresponding configuration.
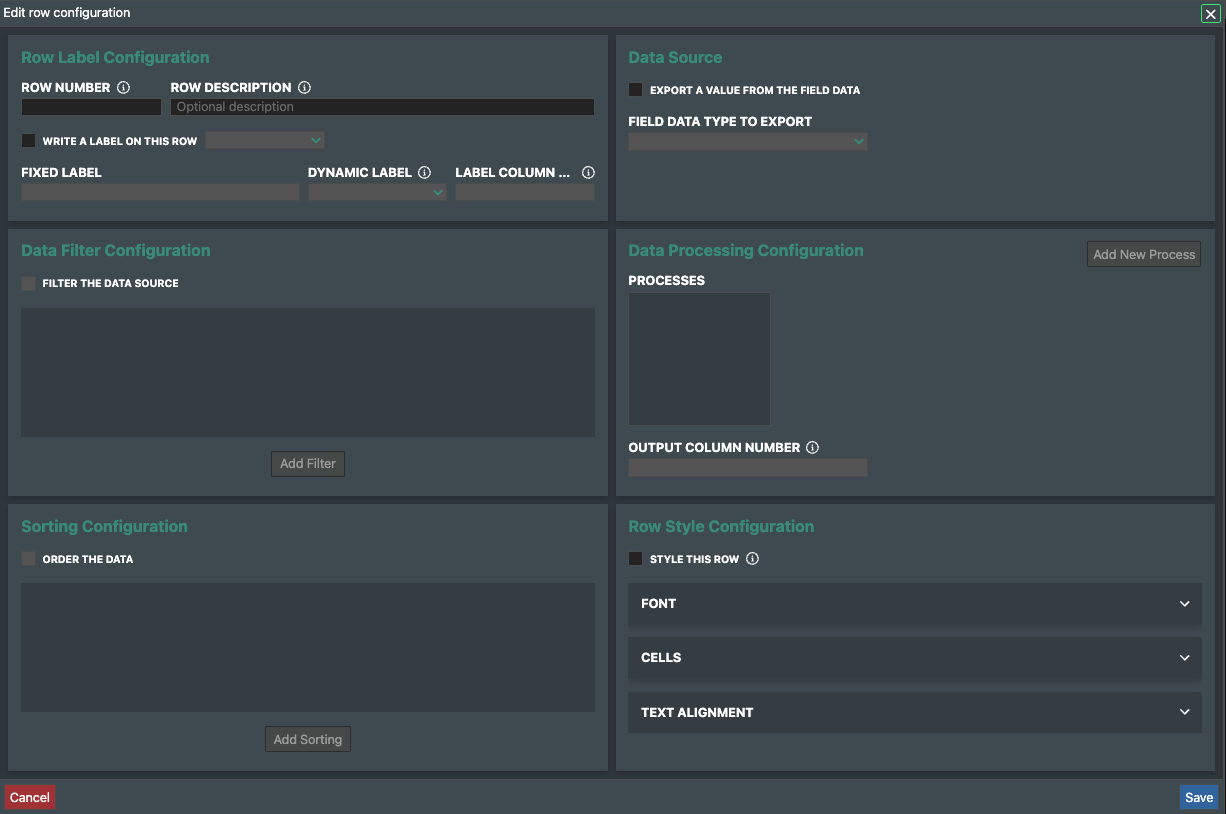
Edit Row Configuration
The Edit Row Configuration pop up window provides functionality to configure the reporting function by specifying cell location, labels, data source, selecting processes, applying filters. You can also sort and style outputs.
Row Label Configuration
-
Row Number - field allows you to define which row the configuration output should show in the report. The row will be filled in automatically if the row configuration was created by right clicking in a template cell.
-
Row Description - You can add an optional row description.
-
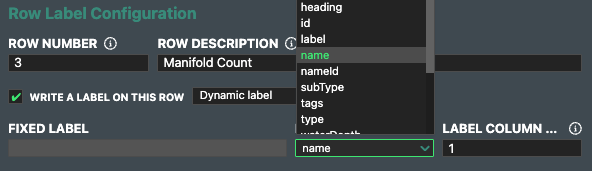
Labels - you can add a label for your output by checking the Write a Label on this Row option and selected either fixed or dynamic label type in the dropdown to the right.
-
Fixed labels allow text that does not change and can be populated in the Fixed Label field.
-
Dynamic labels provide the option to set the label to an attribute of the data source. Select the attribute from the drop-down list. (Note: dynamic labels can only be defined once the data source is defined).
This label will show on the same row of the report spreadsheet but in a different column, which can be specified in the Label Column Number field. Default settings will select the left-hand column to the output cell.
-
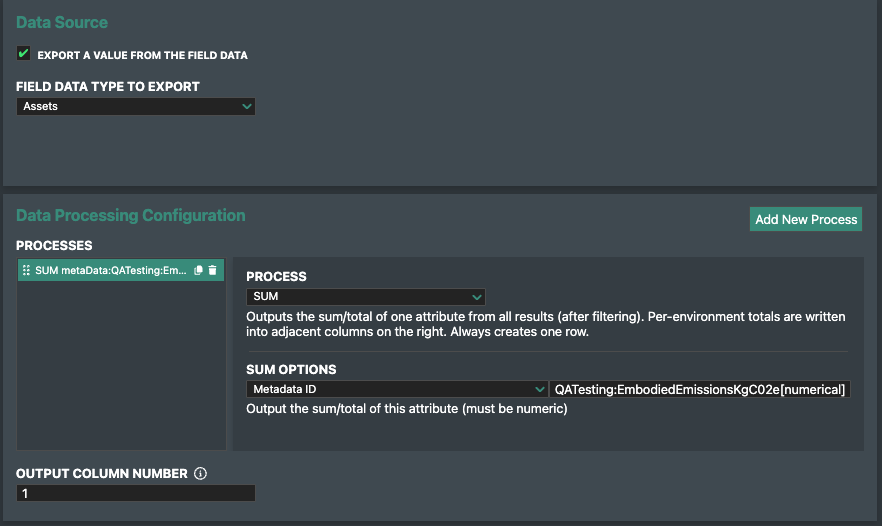
Data Source
To set up a process, you first need to define the data source to specify which data type will be queried from your project. The data source options available depend on which template environment you have selected at the create template stage. The data processing configuration panel will be greyed out until a data source is selected.
Check the Export a Value from the Field Data option and choose a data source from the drop down. The data source will define which data processing configurations are available (processes are explained in the Data Processing Configuration section).
Account environment data sources
- Account - Query name and id.
- Users - Information on users such as user count, user emails and list of unique users.
- Workflow tasks - Options to query tasks such as counts, filter by status, query tags etc.
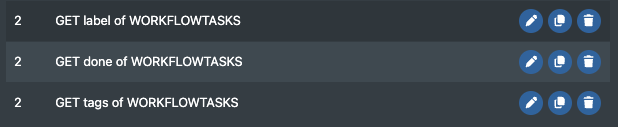
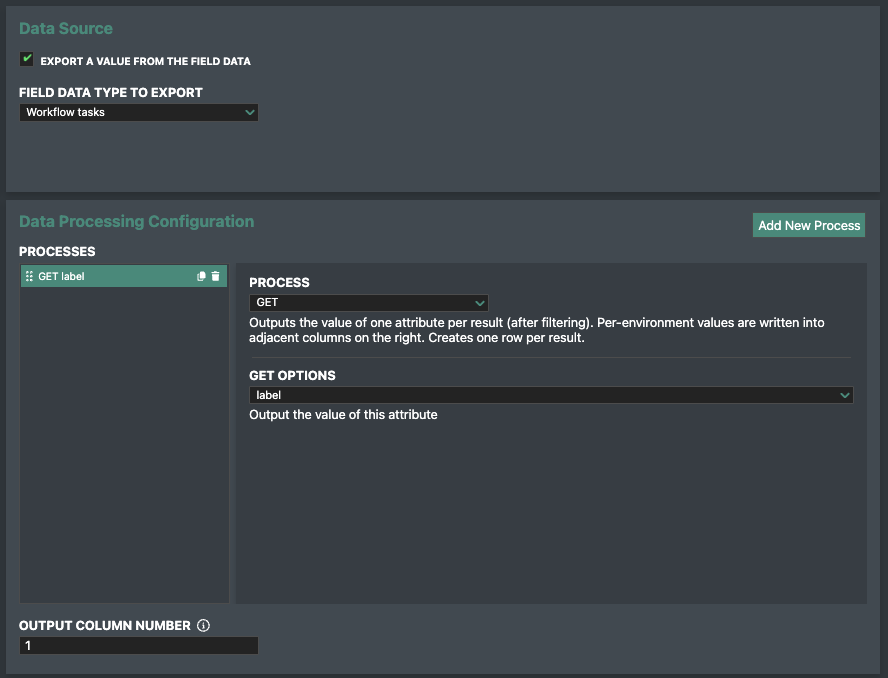
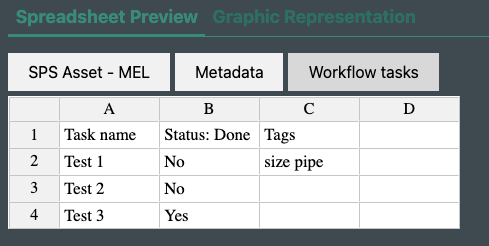
Below is an example of configurations that output a report with task label, status and tags.
Spreadsheet Configuration:
Data Processing Configuration for task label column:
Report Preview:
Project environment data sources
- Project - Return project information such as name and id, track updates and run processes such as project count and list of distinct projects.
- Subprojects - Return subproject information such as name and id, track updates and run processes such as subproject count and list of distinct subprojects.
- Members - Query member emails and return counts and distinct list of members.
- Workflow tasks - Run task counts, filter by status and return task tags.
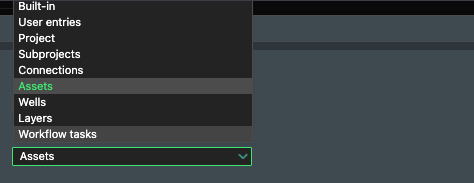
Subproject environment data sources
-
Built-in - Provides information on report creation such as date the report was run and email of the user that ran the report. Use the GET process to see options available.
- Placeholder - Returns the text 'placeholder' in a cell.
- Blank - Returns a blank cell.
-
User entries - Allows you to write custom text into a cell at the report build stage under the Additional Input tab. Process will automatically be set to GET value.
-
Project - Provides process options to query project settings data using the GET process such as project currency and seabed level.
-
Subprojects - Use GET process to query subproject data such as name and id.
-
Connections - Allows you to query project data relating to connections such as total length, number of connections, metadata values and metadata summary tables. See processes section for more information.
-
Assets - Provides relevant processes such as ability to query counts per type, metadata, co-ordinates, and the ability to check if certain assets exist in the project.
-
Wells - Allows you to query metadata relevant to wells such as depth.
-
Layers - Allows you to query metadata relevant to layers such as min, max and average depth.
-
Workflow tasks - Options to query tasks such as counts, filter by status, query tags etc.
Data Processing Configuration
Process set-up
Here you can define which process to apply to your source data to create the desired report output, such as calculating a count of assets or getting connection lengths. You can then apply filters to only query desired object or data types.
Add New Process - Select this button to create a new process. Processes are listed in the left-hand panel. Use the Output Column Number field to specify in which spreadsheet column the output should show.
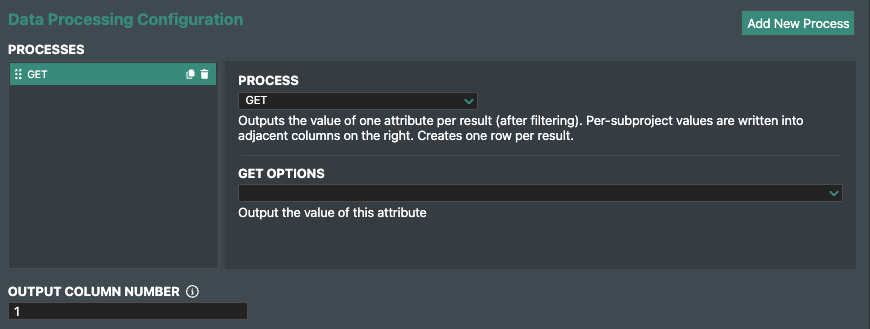
Process & Option Selection - Select the process from the process dropdown. A description of the process will show under the process field. Once the process is selected, a dropdown will appear where you can select applicable options. For example, for the GET process, you select from the GET Options dropdown which attribute you want to query such as length, metadata or date.
Example of GET process options for Asset data source:
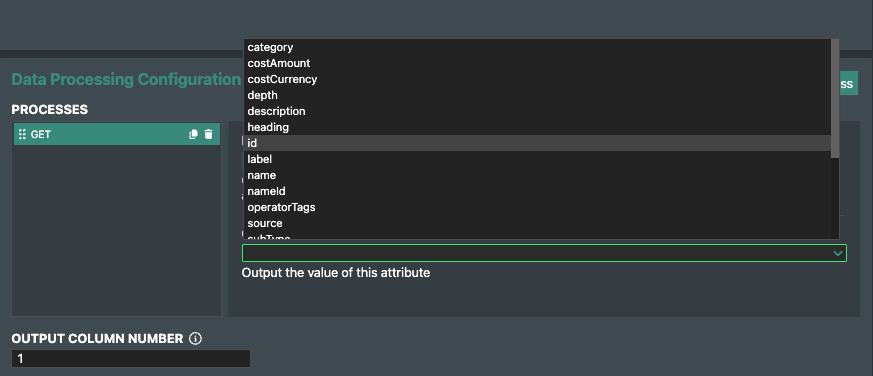
You can add multiple processes which will be ran sequentially (e.g. GET then EVAL - see table below for process desciptions). Selected processes will appear on the left-hand side of the panel and can be cloned or deleted here using the icons.
If a process queries across multiple subprojects, the report will output a new column of values for each subproject output.
Available Processes
Processes are summarised below. Descriptions for each process are displayed in the Edit Row Configuration window in the Data Processing Configuration panel when a process is selected.
| PROCESS | DESCRIPTION | ||
|---|---|---|---|
| GET | Returns an attribute to be specified in GET option dropdown. | ||
| EXISTS | Checks whether an object / data field exists within your project. | ||
| COUNT | Outputs a count of objects such as assets, connections or wells. | ||
| MIN | Returns the minimum value of numeric attributes such as minimum depth of a surface or the lowest cost object. | ||
| MAX | Returns maximum value of numeric attributes. | ||
| SUM | Returns the sum of numeric values such as sum of connection lengths. | ||
| AVG | Returns the average value of numeric attributes. | ||
| DISTINCT | Outputs the distinct set of values in a project, e.g., lists all asset types. | ||
| COUNT_DISTINCT | Returns the number of distinct values such as number of connection categories. | ||
| MAJORITY | Outputs most common value for a defined attribute. Such as majority of connections are of type x, or the majority of connections cost x. | ||
| SUMMARY | Splits attributes into groups and returns the count, count of distinct values or sum of each group. Define the process under the Type field and select the attribute to group by under the Grouping dropdown. SUMMARY example: You can return a count of all asset categories. You have an option to include a text summary into the output cell describing which summary process type was applied.
|
||
| METADATA_TABLE | Outputs metadata field names and values in columns from left to right. Add and select attributes to output under metadata table options. | ||
| SPLIT | Allows you to split workflow tasks into buckets. | ||
| EVAL | Allows you to apply an Excel formula to numerical outputs. E.g., multiply number of assets by 3 or convert cost output format from '1000000' to '$1M'. Add a process before the EVAL process to get the input value that the EVAL equation will use. |
Querying Metadata
There are two ways to do this.
-
To output a table of metadata values, use the METADATA_TABLE process described in the table above.

-
Query metadata values individually using the Metadata ID option in the Data Processing Configuration panel. Input the metadata definition ID, vendor ID or metadatum ID in the field to the right. This allows you to use metadata as input for processes such as GET, SUM, AVG, COUNT, etc.
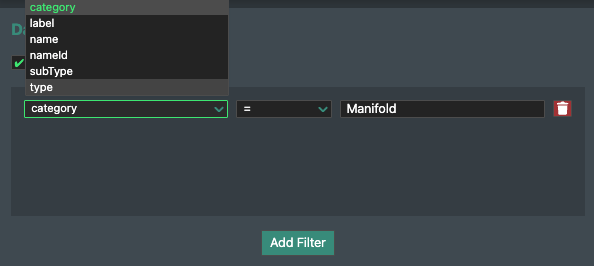
Data Filter Configuration
To apply filtering check the Filter the Data Source option then click the Add Filter button to add a filters with several filtering options. You can apply multiple filters. To define the filter condition, select than attribute from the left-hand dropdown and enter a value in the right-hand field.
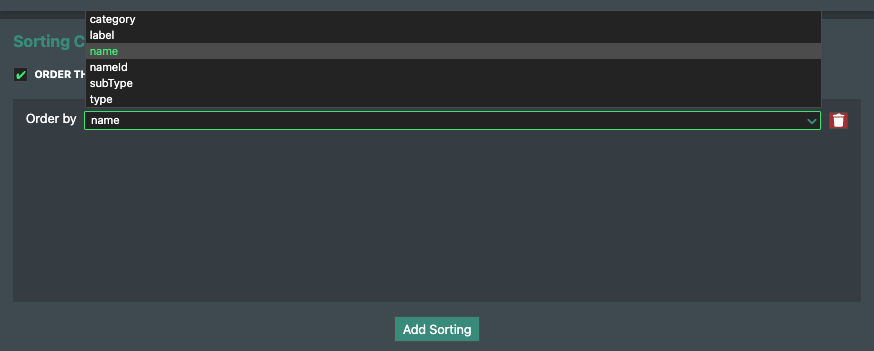
Sorting Configuration
Check the Order the Data option to apply sorting and select the attribute to use for sorting ordering from the dropdown. You can add multiple sorting criteria for nested sorting.
The selected sorting option will be applied to the congifuration output column (and label column if a label has been defined) and will also be applied to all columns to the right.
The selected sorting configuration will be applied to the rows below, until a row occurs containing a configuration with a different sorting configuration.
Note: Be aware that if a row has mulitple configurations with different sorting options selected, you will have a miss-match between objects and their attributes, for example you may have an asset label in column 1, and a metadata value in column 2. If different sorting options are applied the metadata value in column 2 will not correspond to the asset in column 1.
To avoid this, set your sorting option in column 1 and do not apply any other sorting options for other configurations in that row.
Row Style Configuration
You can set the font, cell colour fill and text alignment style for each row. Check the Style This Row option and use the Font, Cells and Text Alignment drop downs to select style options.
To copy styling settings from another configuration, select the row from which you want to copy the settings in the Copy From drop down.
To apply styling settings to all cells containing a configuration, press the Apply to All button.
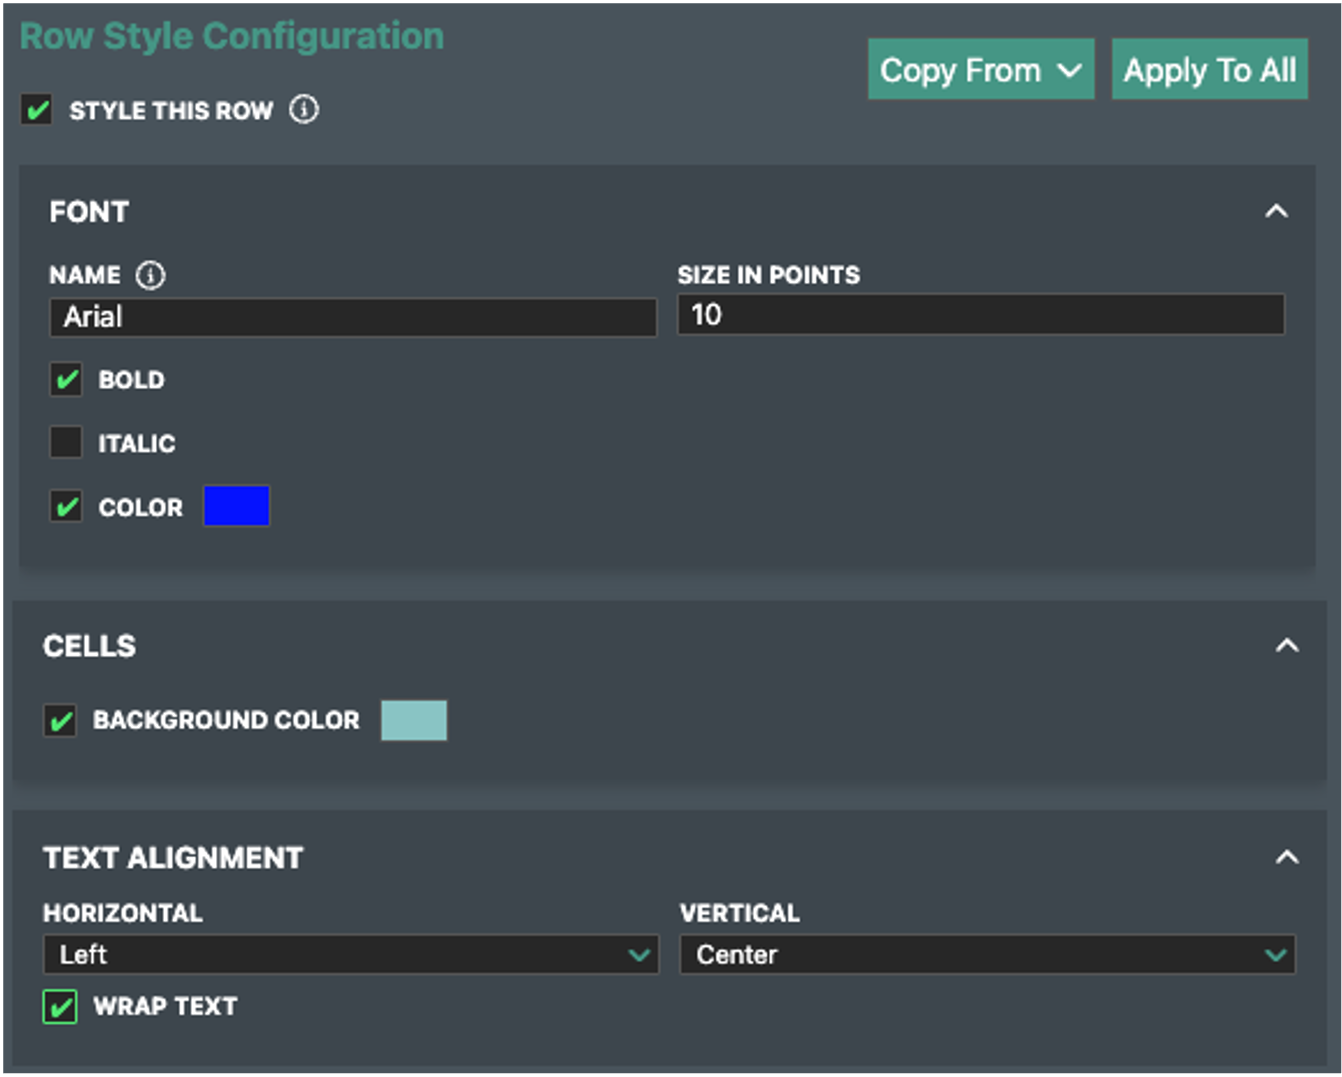
Click save to apply changes.
Graphic Configuration
Create and download automated pie, doughnut and line graphs using report outputs.
The Graphic Configuration tab can be found in the tab to the right of the Spreadsheet Configuration tab.
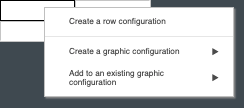
Click the Add Chart button or right click in a cell in the template preview to create a new chart. You can also select the 'Add to an existing graphic configuration' to apply a previously made chart. Select the edit icon to configure the chart.
In the Edit Graph Configuration pop-up window you can define a description title, chart type, value inputs and colours.
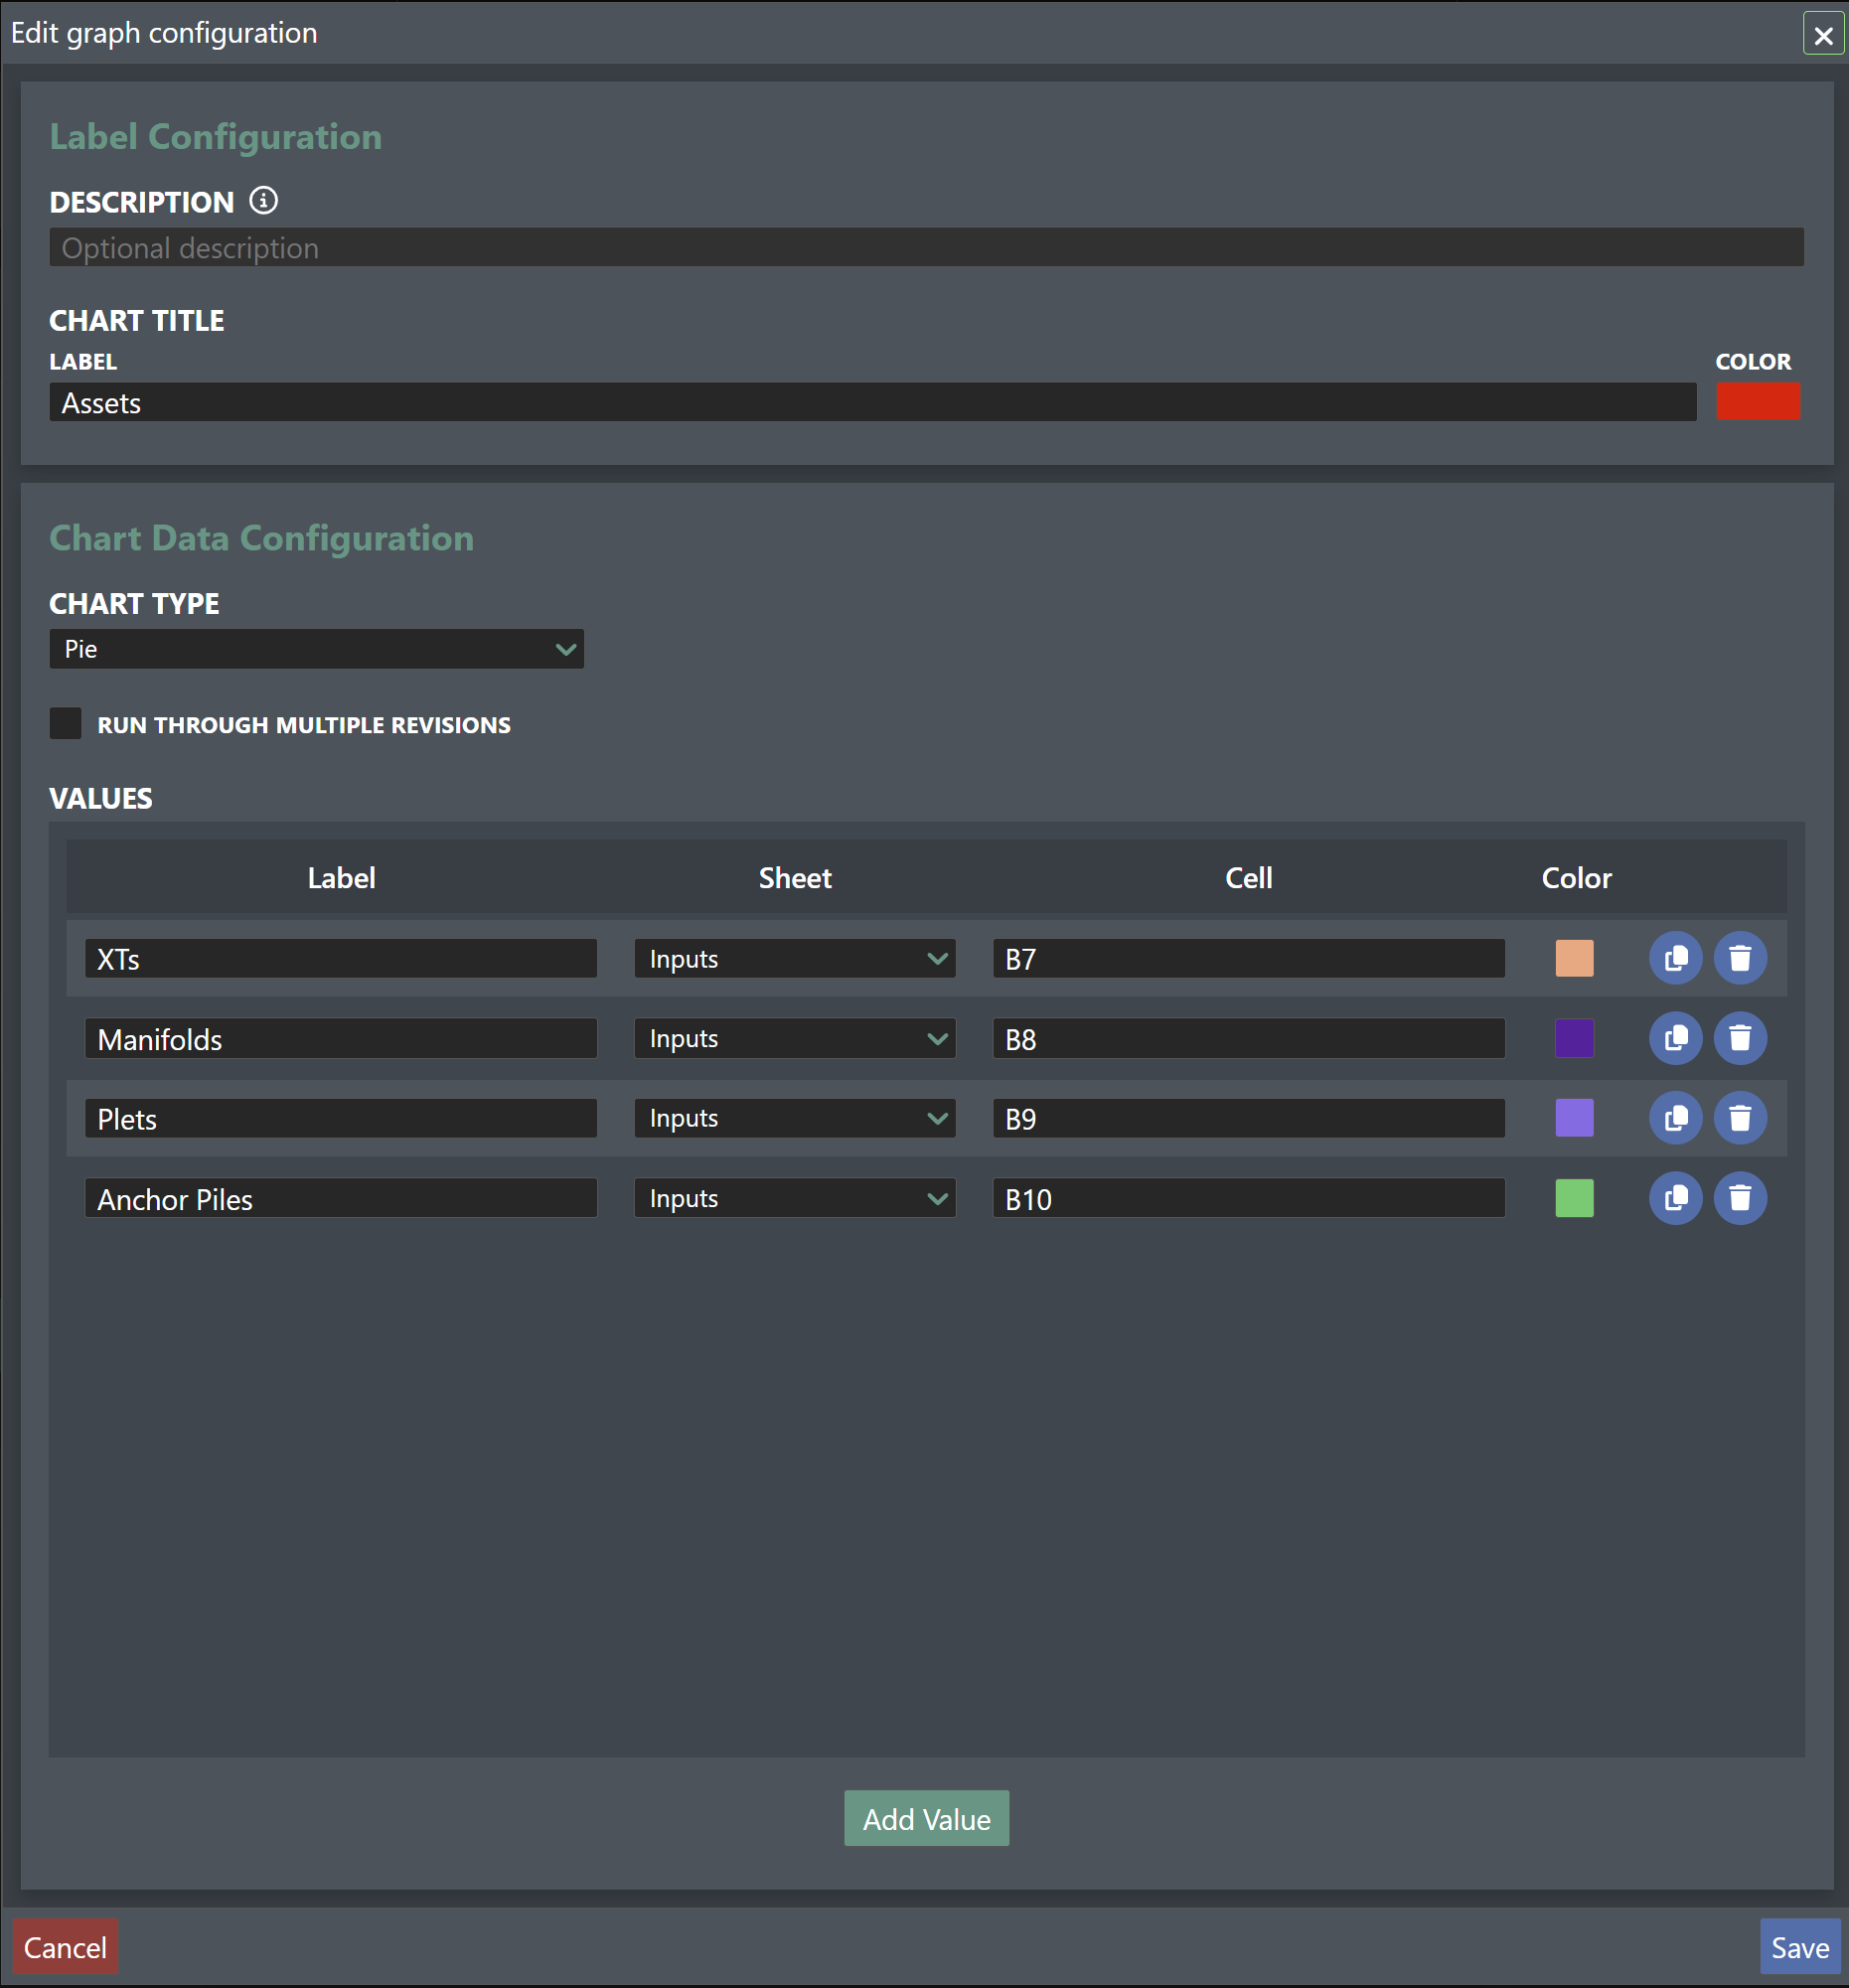
Run Through Multiple Revisions - Check this option to produce a graph or chart which captures how values change across different report versions. For example, a line chart showing how cost has changed over time in progressive report versions.
Values - You can add multiple values to each graphic.
-
Label - Define a label that will show when you hover over the data point on the output graphic.
-
Sheet - If the template spreadsheet has multiple sheets, select which one to use as input.
-
Cell - Type the report cell which the graphic should use as input.
-
Colour - Applies colour fill to doughnut and pie charts and defines the colour of data markers for line charts.
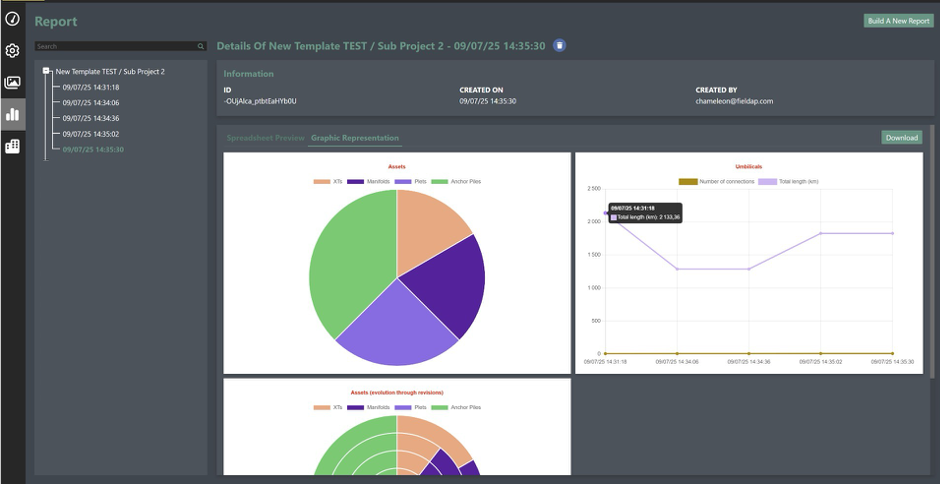
Press save to complete the graph configuration. Below is an example of a graphical output which will be shown once the report is built.
On the right is an example of Run Through Multiple Revisions being applied to give a line chart with the creation date and time of different report versions along the x-axis to show how values change over time.
Building a New Report
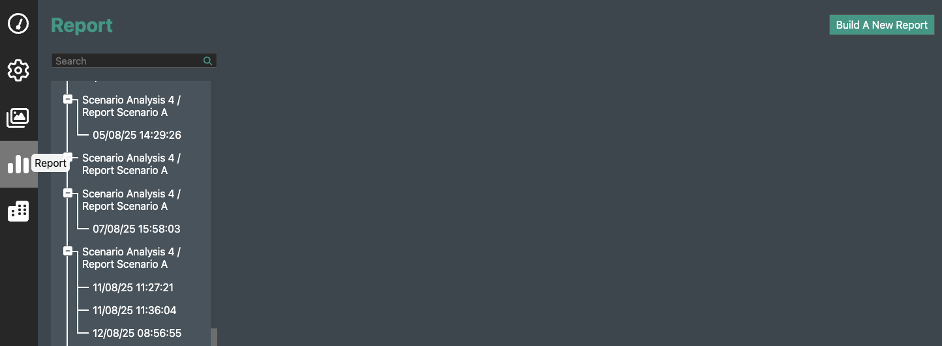
To run a new report, go to the Report tab on the main side panel (see navigation section) and click the Build a New Report button in the top-right corner. This opens the report build workflow.

Selecting Report Inputs
Select a Report Template in the left hand panel.
Select a Subproject in the right hand panel. If you have checked Select Multiple Subprojects at the Report template settings stage in admin, select any subproject in the select a subproject panel to be able to progress to the report build stage where you can select the individual subprojects to include in the report.

You can change the default report name using the field at the bottom of the screen.
Running a Report
The Build or Build & Run button on the bottom right of the Build a Report window give you the option to:
Build:
Choosing Build takes you to the Report Details window.
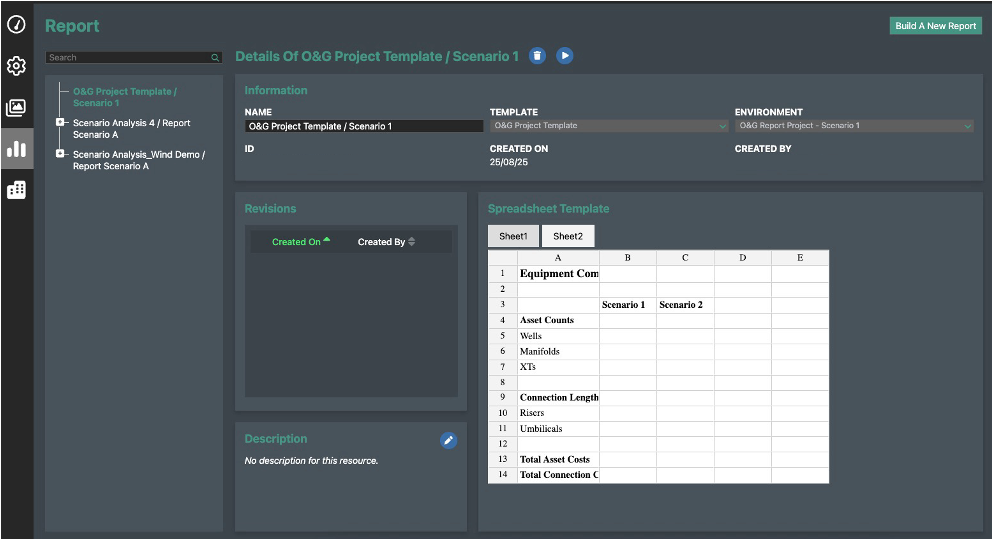
Here, you can:
-
Edit the report name and description
-
Run the report using the play icon or by right clicking on the report name in the right hand panel. You will need to re-run the report to see changes made to the report template since the report was run.
-
View all saved versions of the report in the left-hand panel
-
Delete the report using the delete icon or by right clicking on the report name in the right hand panel
Build & Run:
If you select Build & Run, you'll be taken directly into the report generation process.
A Run a New Report popup will appear with two tabs:
-
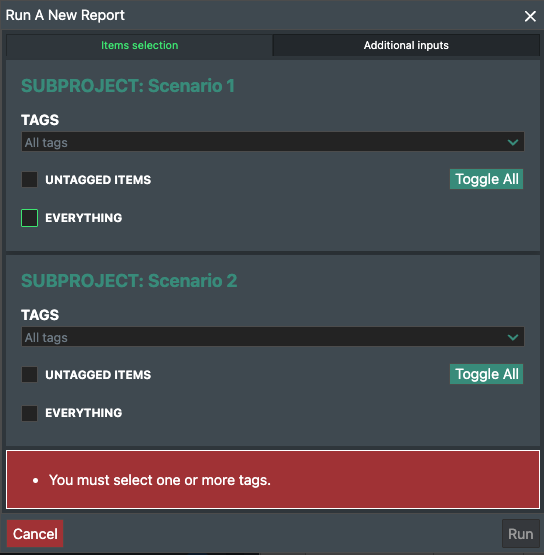
Items Selection - filter the data to be included in the report by adding tags in the TAGS field or check the UNTAGGED ITEMS or EVERYTHING option.
- Selecting Multiple Subprojects - If you have checked the Report Across Multiple Subprojects option within report template settings under admin settings, all available subprojects will be shown. Select tags or check the UNTAGGED ITEMS or EVERYTHING option to include that subproject in your report. If no tag option is selected for a subproject, that subproject will not be included in the report.
-
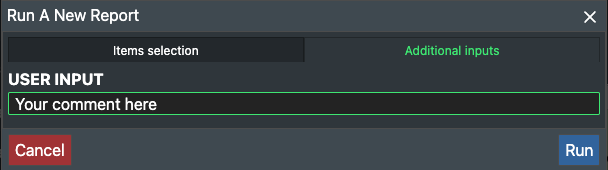
Additional Inputs -- If you have configured a User entries GET value process, this is where you can define the custom value that will appear in the output cell. The text above the input field can be defined by adding a description to the configuration.
Click the run button to create the report.
Report Preview
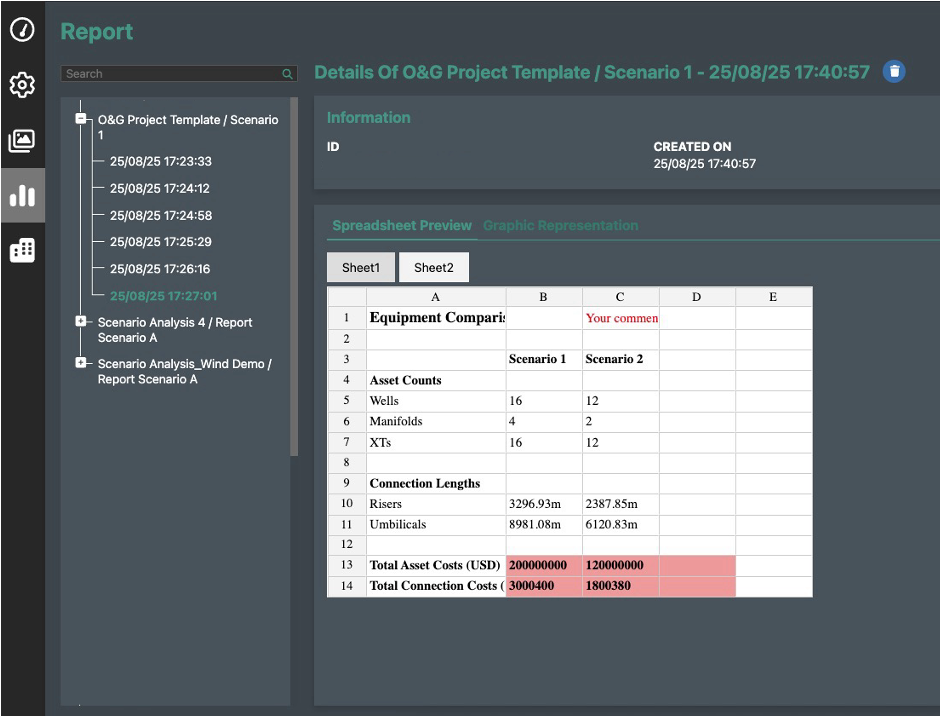
After running a report, a preview will appear in the Report Details window. The new report version will appear in the left-hand panel with a date and timestamp of the report version. You can delete individual report versions using the delete icon at the top of the window.
The preview window includes basic report details and two tabs: one for Spreadsheet Preview, and another for Graphic Representation.
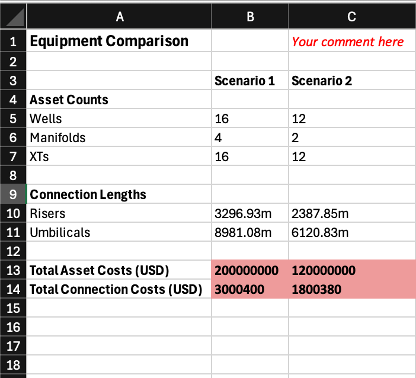
The Spreadsheet Preview below gives an example where two sub-projects are compared. Sub-project 1 results are shown in column B and Sub-project 2 results are shown in column C.
Download
To download the report or graphics, click the Download button on the right-hand side. This will export the report in Excel format where you can further format and edit the Report outputs as required.