Annotations & Anomalies
When using FieldTwin Operate you will typically see assets, pipelines, wells etc. with annotation icons on them as for this structure shown below:
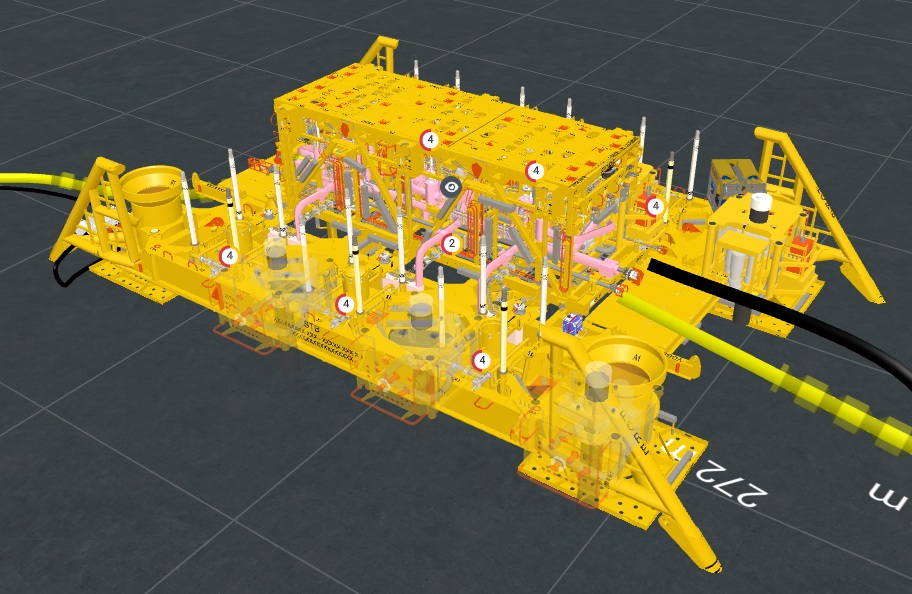
Annotations on objects (in the Viewport) means that there are associated Events, Anomalies, or Tasks from the connected data sources.
Note! - Annotations are created in FieldTwin Design, or comes from associated data souces in FieldTwin Operate.
Annotation Grouping
Based on the viewport zoom level e.g. distance from the object FieldTwin Operate works similar to Google Maps where you will see the total number of annotations for the obect displayed e.g. grouped as one with the total annotation count e.g. (26) in this example:
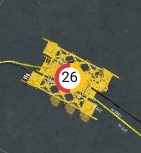
Then as you zoom inwards e.g. get closer to the object you will then see the annotations resolve themselves into different annotation objects such as the top screenshot shows.
Annotation Selection
When clicking on an annotation you will then see a window open listing the associated events or alerts:
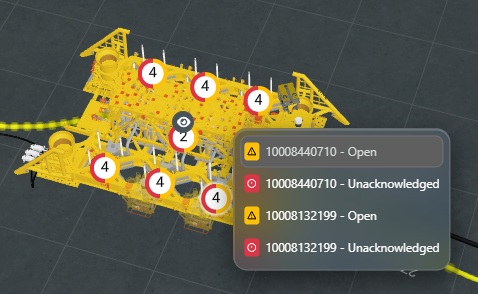
You can then select the event or alert from the list, which will display the Anomalies Window.
Anomalies Window
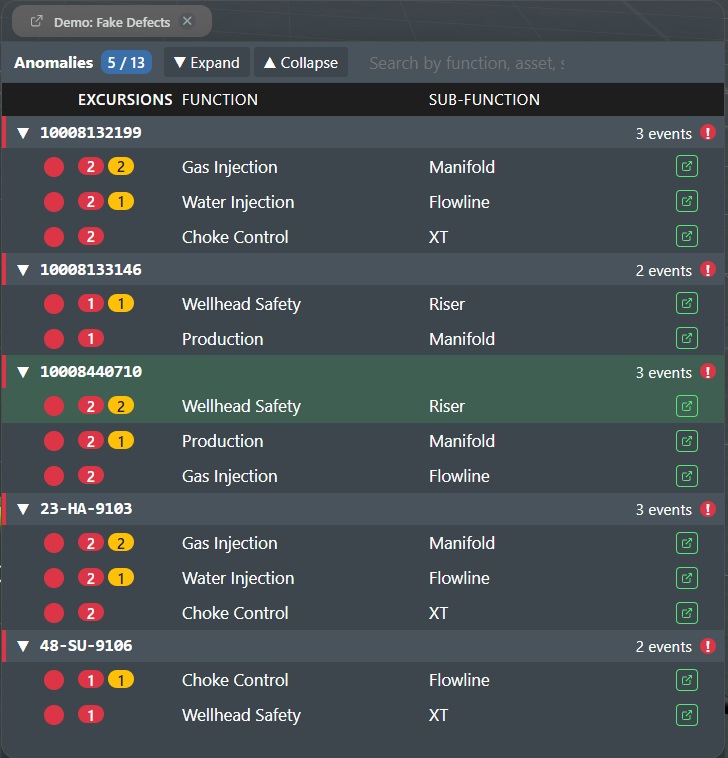
When you have have selected an event or an alert for an object the following window will be displayed:
Anomalies Commands
The top part of the window as shown here:

has the following commands:
↗ - The icon to the left of the Demo: Fake Defects title caption will pop out the window so it becomes standalone.
⮽ - Click on this icon to close the Anomalies window.
Anomalies Counter - Displays the groups/event count numbers.
Expand - Expands the groups if they are collapsed.
Collapse - Collapses the groups if they are expanded.
Search - Simply start typing in the search field to narrow down the list of events.
Anomalies Group List
The list of events by group the looks as follows:
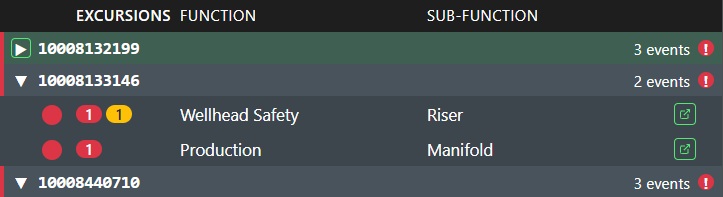
Right arrow - Expands a group.
Down arrow - Shows the group content and clicking on the arrow will collapse it.
List Entry - Click on a list entry and the viewport will update to zoom in on the object or the asset where the event is associated with. For complex assets it will highlight the system or specific part in question for visibility.
↗ Open in Source System - The rightmost icon in the list entry will then launch the source system from where the event originated in a new window, or you can also double click the event entry to launch it.