Time Series
As part of FieldTwin Operate you can view time series data if the so provided by the connected data sources. Time series are especially useful for anomaly detection in an operation scenario and might indicate the need for inspection, maintenance and repair.
As an example the screenshot below is a time series from a cooling unit returned by CDF as a data source
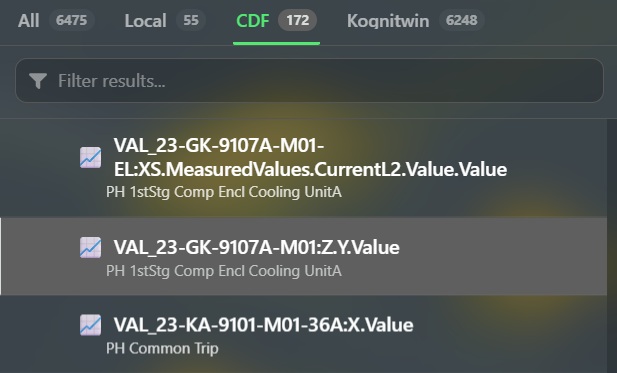
Viewing Time Series
By selecting a time series object and clicking on it FieldTwin Operate will then display the time series viewer as shown below:
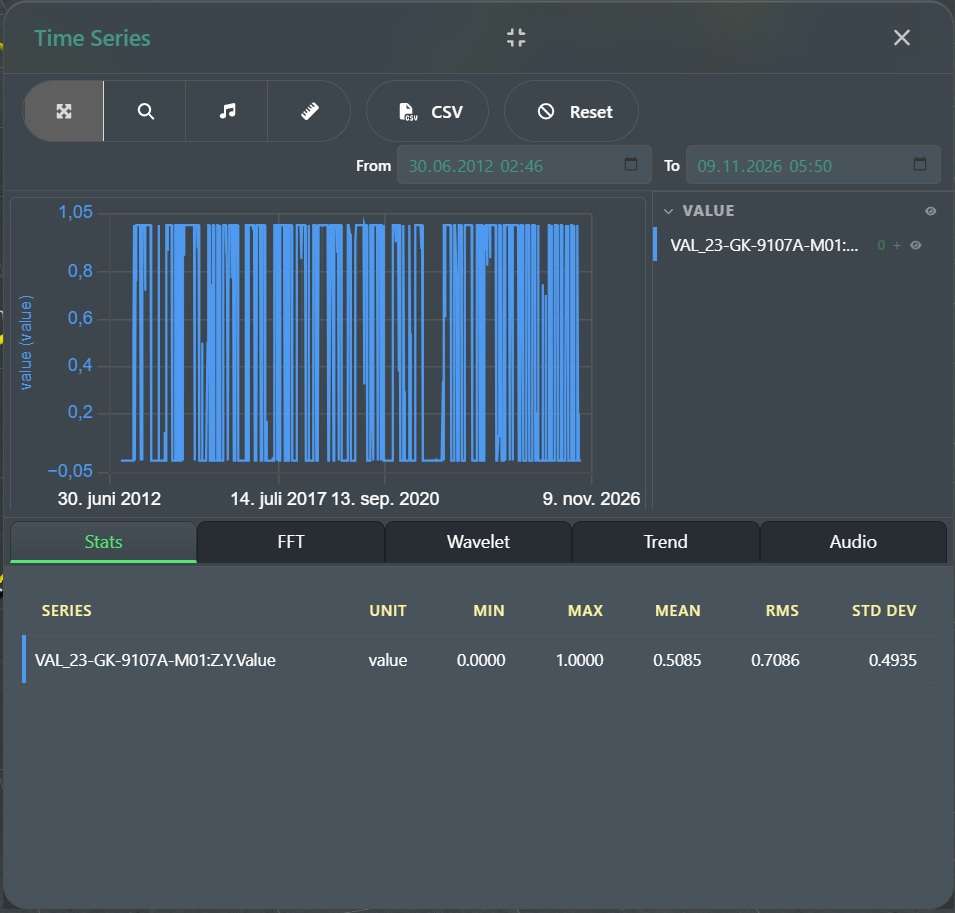
Time Series Commands
The time series viewer has the following commands and options:

The available commands shown above next to the Time Series caption are as follows from left to right:
Maximize / Restore - Click on this to maximize the time series windows. Click again to restore it back to the original view.
⮽ - Click this icon to close the time series window.
Below that you will find:
Pan - Selecting this will allow you to pan around the time series.
Box Zoom - This allows you to create a zoom rectangle in the time series graph to zoom in for more detail.
Audio - This allows you to listen to the time series as audio when you press the play button that appears when selecting this command. Press Stop to cancel.
Measure - Use the mouse to select two points from left to right by clicking once and then moving the cursor and clicking twice. A dialog with information of the days/hours for the selected range will be displayed.
CSV - This will export the time series out as a CSV (Comma Separated Value) file to your download directory.
Reset - This will restore the time series to the original view.
From: / To: - This displays the dates of the time series loaded. You can also click on the calendar icons to change the from and/or to dates to update the view.
Graph Commands
The time series graph has the following commands and options in the VALUE section to the right:
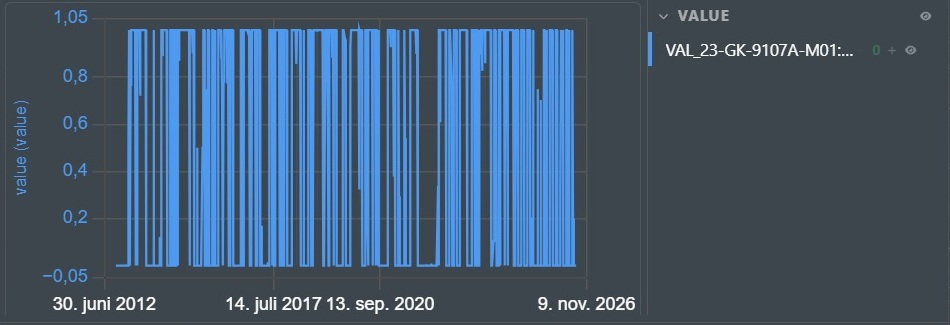
- 1 + - To the right of the name of the time series on the value section you can select the graph pane you want.
👁 Eye Icon - Clicking on the time series name or the eye icon will toggle the time series on or off.
⮽ - Remove the time series.
Informational Tabs
The lower part of the time series window is comprised of 5 Tabs namely Stats, FFT. Wavelet, Trend, and Audio:
Stats Tab
The Statistics tab looks as follows with the following values shown:

SERIES - Name of the selected time series shown.
UNIT - The unit of measurement used if any.
MIN - The minimum value in the series.
MAX - The maximum value in the series.
MEAN - The mean value in the series.
RMS - The root mean square value in the series.
STD - The standard deviation value in the series.
FFT Tab
The Frequency Spectrum Tab looks as follows:
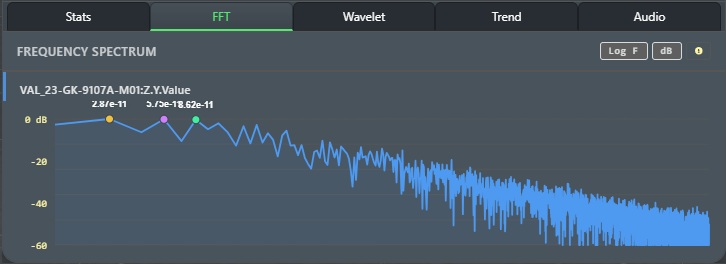
Log F - Toggle logarithmic frequency scale.
dB - Toggle dB amplitude scale.
 - Displays extended help information about the options above.
Wavelet Tab
What is DWT?
The Discrete Wavelet Transform (DWT) breaks a signal into time and scale. Unlike FFT, which only shows what frequencies exist, wavelets show where and when they happen.
The Wavelet Decomposition Tab looks as follows:
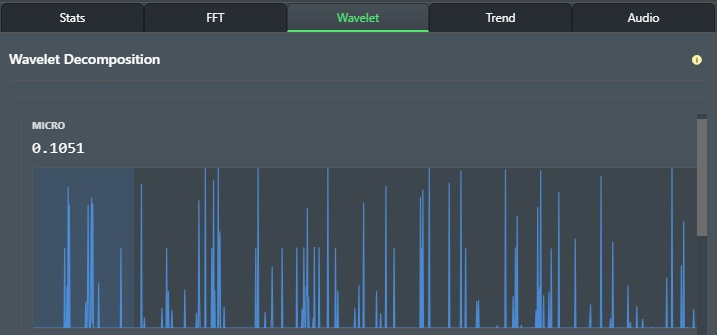
Here you have a series of graphs for Micro, Fine, Small, medium, and Course that you can view by scrolling down.
Micro/Fine - Detects sharp spikes, noise, and sudden discontinuities (fast changes).
Medium - Captures rhythmic pulses and short-term oscillations.
Coarse - Identifies broad trends and low-frequency structures (slow changes).
- Displays extended help information about the options above.
Trend Tab
The Trend Tab looks as follows:
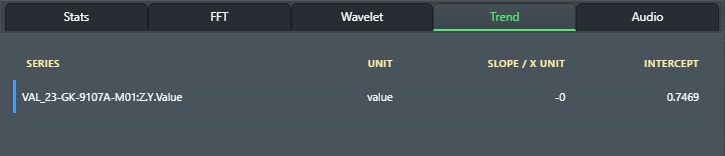
SERIES - Name of the selected time series shown.
UNIT - The unit of measurement used if any.
Slope / X Unit - The trend slope in a time series measures the average rate of change (rise over run) of a variable over time.
Intercept - Represents the baseline estimated value of the time series when the time index (t) equals zero. It sets the starting level of the trend line.
Audio Tab
The Audio Tab looks as follows:
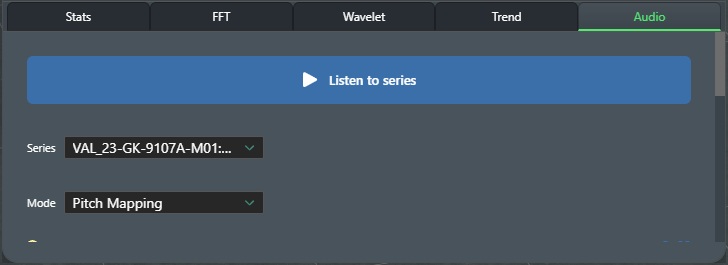
Listen to series - Plays the selected time series data as audio.
SERIES - Select the desired time series of more than one (1).
Mode - Select the audio playback mode from the drop-down menu between Pitch Mapping or Raw Audio Buffer (PCM).
Duration - Use the slider to set the duration for the time series playback in seconds.
Pitch Range - Use the slider to set the pitch range by adjusting the spread between min /max data values in semitones.
Oscillator Waveform - Select the waveform from the drop-down menu from Sine, Triangle, Square, or Sawtooth.
Volume - Use the slider to set the volume level.