Getting Started
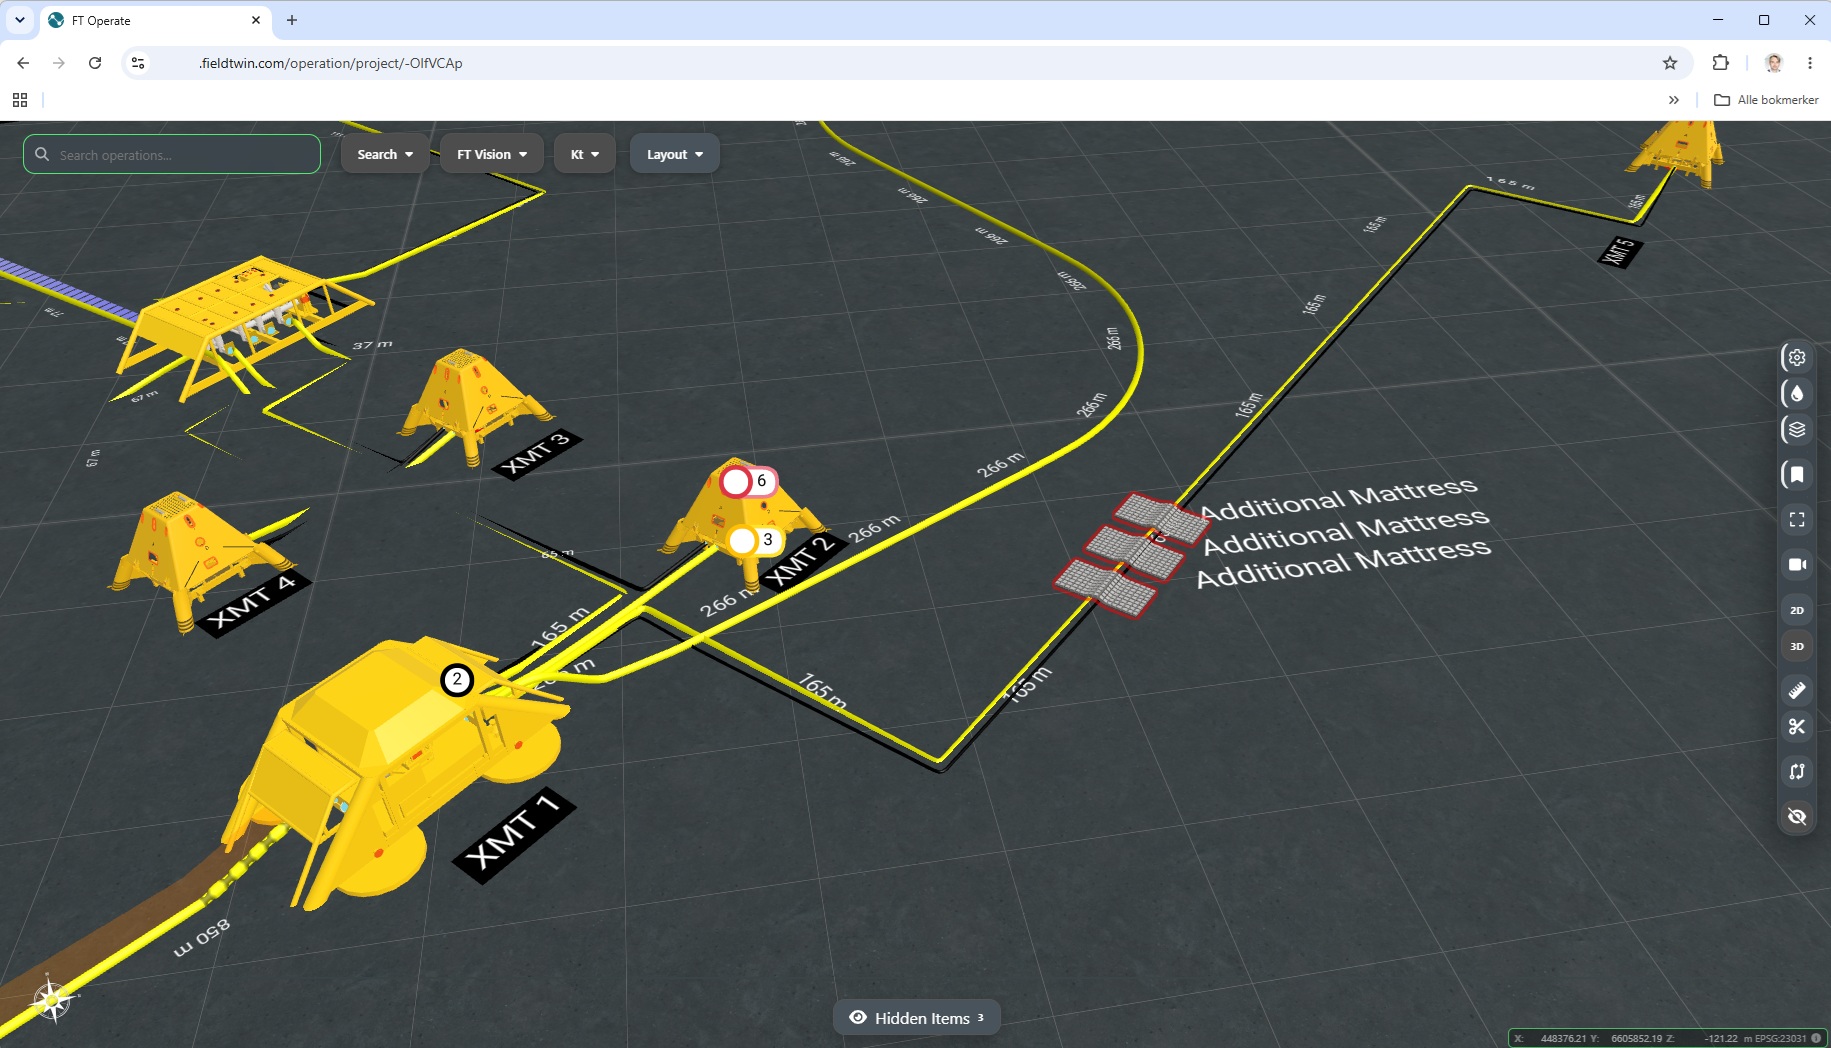
After logging into your FieldTwin Operate tenant with operate project URL you will see your field layout displayed in your browser as shown in the sample operation project screenshot below:
Open, maximise and close panels
Operation mode does not have a dockable layout. It has a panel row: tabs along one edge, one panel open at a time, sized by dragging:
| Control | Does |
|---|---|
| A tab | Opens that panel |
| The resize handle | Drags the panel bigger or smaller |
| Maximise | Expands the panel over the view |
| Restore | Puts it back |
| Close | Hides the panel, leaving the tab |
| Pop out tab | Opens an integration tab in its own window |
 Maximise the current panel for reading, then restore it without changing the selected tab
Popping out
An integration tab can be popped out into a separate browser window - which is what you want on two screens: the 3D field on one, the maintenance system on the other, both live. The popped-out window keeps talking to the 3D view, so selecting in one still affects the other.
Maximise for reading, pop out for working
Maximising is quicker but hides the field. Popping out is the arrangement to use when you will be going back and forth for an hour.
Why the layout is fixed
Because operations users arrive with a question and a tag number, not a workspace preference. A fixed layout means anyone can be told “search the tag, open Documents” and it works on their screen too - and it is one less thing to explain during an incident.
Main commands
Then you will have three (3) main toolbar sections with commands you can utilize to search, find and quickly view the information you are looking for:
Hover before clicking
Every button has a tooltip that says exactly what it does, and several change meaning with state - the same button hides or shows depending on what is currently visible. When in doubt, hover.
Top command bar
At the very top left of the screen you will see the following toolbar as shown below:

From left to right the following functionality is available for you:
Search operations
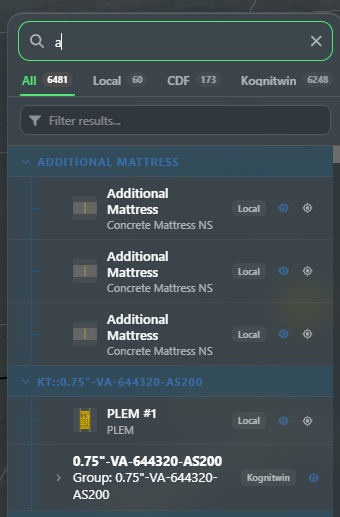
This free text search field allows you to type in what you are looking for. You can even type in a single character and press Enter and it will search through any connected data source and display the results as shown in the results window below:
See the full details and capabilities on Operations Search Capabilities functionality.
Search
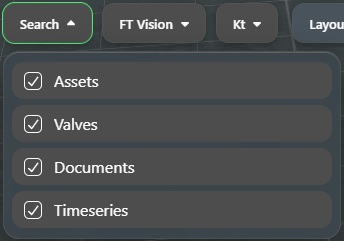
Pressing this button will display a drop-down list with the data categories available to you from the connected data sources. You can check/uncheck the categories to include or exclude them from the search operation as shown here:
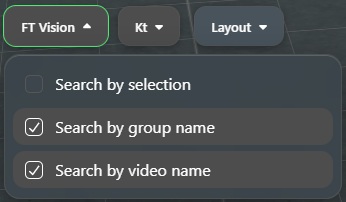
FT Vision (ROV)
Pressing this button will display a drop-down list with the search categories available for FieldTwin Vision. You can check/uncheck the categories to include or exclude them from the search operation as shown here:
Kt (KogniTwin)
In this sample project KogniTwin is connected as a data source and the drop-down list with the available search categories is displayed. You can check/uncheck the categories to include or exclude them from the search operation as shown here:
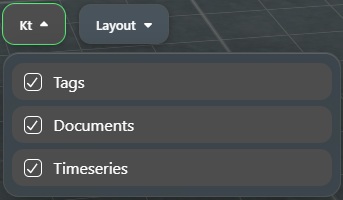
Note! You will see similar search category options if more data sources are connected.
Layout
The Layout button will display a list of all the module windows registered with the application as shown here:
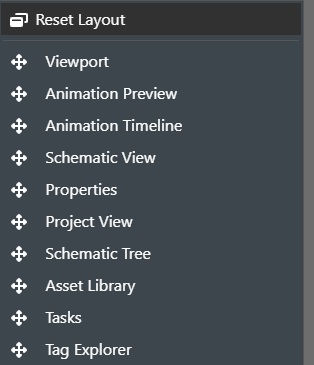
If you have closed any of the module windows, you can select it from this list to make it visible again. Click on Reset Layout to revert all the module windows to their default setting.
Right command bar
This command bar is comprised of various functions and settings for controlling the various view and information options including viewport settings. In addition, you also have measurement tools, and access to the point cloud compare feature. See the table below for an overview:
| Command | Description |
|---|---|
 |
Access Viewport Settings |
 |
Highlight Systems |
 |
Display the list of project layers |
 |
See the available navigation viewpoints |
 |
Zoom Extent |
 |
Active Flythrough Mode |
 |
Switch to 2D View |
 |
Switch to 3D View |
 |
Switch to Schematic View |
 |
Activate the Measurement Tool |
 |
Activate the 3 Point Angle Measurement Tool |
 |
Activate Clip Plane Tool |
 |
Activate Point Cloud Compare |
 |
Hide distant Annotations |
 |
Launch the built in documentation |
Viewport Settings
Clicking on the Viewport Settings icon will display the following settings options as shown below:
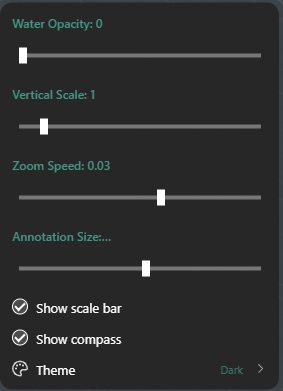
| Setting | Effect | Turn it on when |
|---|---|---|
| Show water | Draws the sea surface | Presenting, or explaining depth |
| Zoom Speed | Changes the zoom speed | Speeds up zoom experience, useful if you are using trackpads |
| Smart Model Detail Distance | Increase how far from the camera detailed smart geometry remains visible | Turn on if you want details further away |
| Zoom to selection when switching views | Keeps the same object in frame across a view change | You move between the schematic and the field |
| Show smart model visibility controls | Eye buttons for per-part visibility on equipment that has parts | You need to see inside a template |
| Show integration tag outlines on smart models | Outlines matching parts with status colours supplied by integrations | An integration publishes status you care about |
| Show 3D grid | A measured grid on every supported surface, not only the seabed | Judging distance by eye |
| Show outlines below seabed and bathymetry | Buried lines and wells, outlined through the ground | Working on anything buried |
| Annotation Size | This allows you to adjust the size of all annotations using the slider control. | Adjust for visibility |
| Show scale bar | A distance scale in the corner of the view | Reading distance off a screenshot |
| Show compass | A north indicator in the corner of the view | The field is not oriented the way you expect |
| Theme | Select the desired color theme from the list of various color schemes as shown below | Use to change look and feel |
| Disable automatic performance fallback | Disable the automatic adjustment of your computers performance if we detect too high a load and then reduce certain parameters to make the experience smoother | Use if thing feels slow |
Highlight Systems
Highlight systems answers the question operations actually asks: what is on this system? Select something and the connected path - the equipment and the lines that join it - lights up, while everything else recedes.
Click on this to display a list of the defined systems in the operation project such as Production, Water Injection etc. The selected system will then be highlighted and animated for visibility on screen.
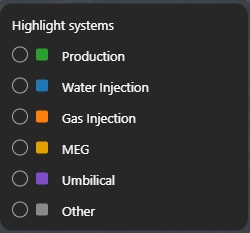
Animate flow - Check this option and the animated flow along the highlighted systems adds direction: the highlight becomes a moving pattern showing which way the fluid goes. That is the picture that makes a system legible to somebody who did not design it - and it is what most operations screens end up showing.

What it tells you!
| Read | From |
|---|---|
| Which way a line runs | The direction the pattern moves |
| Whether a system is one path or two | Whether the pattern is continuous |
| Where a system splits | A junction where the pattern divides |
| Which lines are on this system at all | Only highlighted lines animate |
It is direction, not rate
The animation shows which way, from the design’s direction of flow. It is not a measurement: the speed of the pattern is not the flow rate, and it does not change with live data. For actual values, use time series.
Hide unrelated - Hides geometry unrelated to the highlighted system(s).
Layers
This will display a list of all the layers in the operations project and their visibility as shown below:
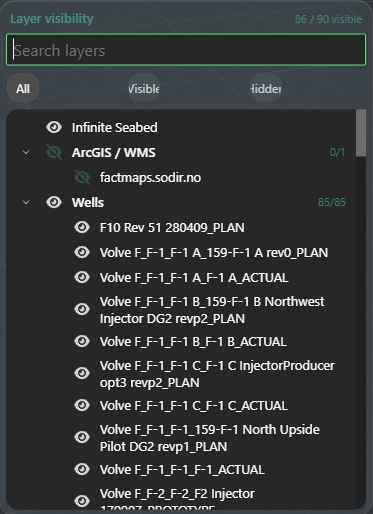
At the top you will see the number of visible layers out of the total number of layers.
Search Layers - The free text field allows you to start typing and the list will then filter automatically based on your input.
All, Visible, Hidden - These buttons when pressed will then in order for the dialog; Display all layers, Show only visible layers, and lastly show only hidden layers.
Toggle Visibility - Click on the Eye Icon to toggle the category, or layer visibility on or off.
Viewpoints
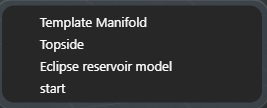
This will display a list of the defined viewpoints in the operations project. Click on the desired viewpoint and the viewport will then display that viewpoint.
Zoom Extent
Automatically zooms the view outwards to fit all present assets/vessels/connections on the stage.
Flythrough Camera
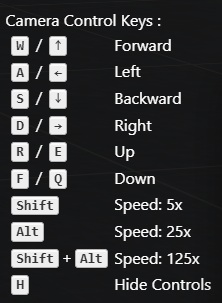
Enables Flythrough Camera Movement for 3D Viewport mode, which is useful for screen recordings or live presentations.
See below for the keyboard navigation overview:
2D Mode / 3D Mode
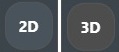
Press the 2D icon for 2D view and 3D icon for 3D view.
FieldTwin Operate is completely 3D driven from a rendering perspective, but a 2D Mode is still available for field layout design but is then represented by the camera showing a top-down perspective of the view port so you get the 2D experience if desired. You can also quickly switch between viewing the view port in 2D or 3D Mode respectively by using the following keyboard shortcuts "2" and "3" respectively.
Schematic View
Click on this icon to display a schematic view of the project if one has been created in FieldTwin Design. If there is more than one (1) schematic created for the project a list of them will be presented for you to select from as shown below:
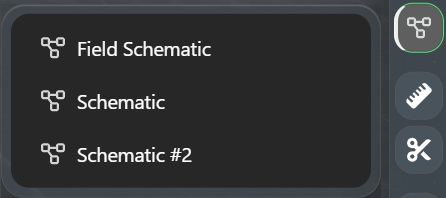
Select the schematic of choice and you will enter Schematic View:
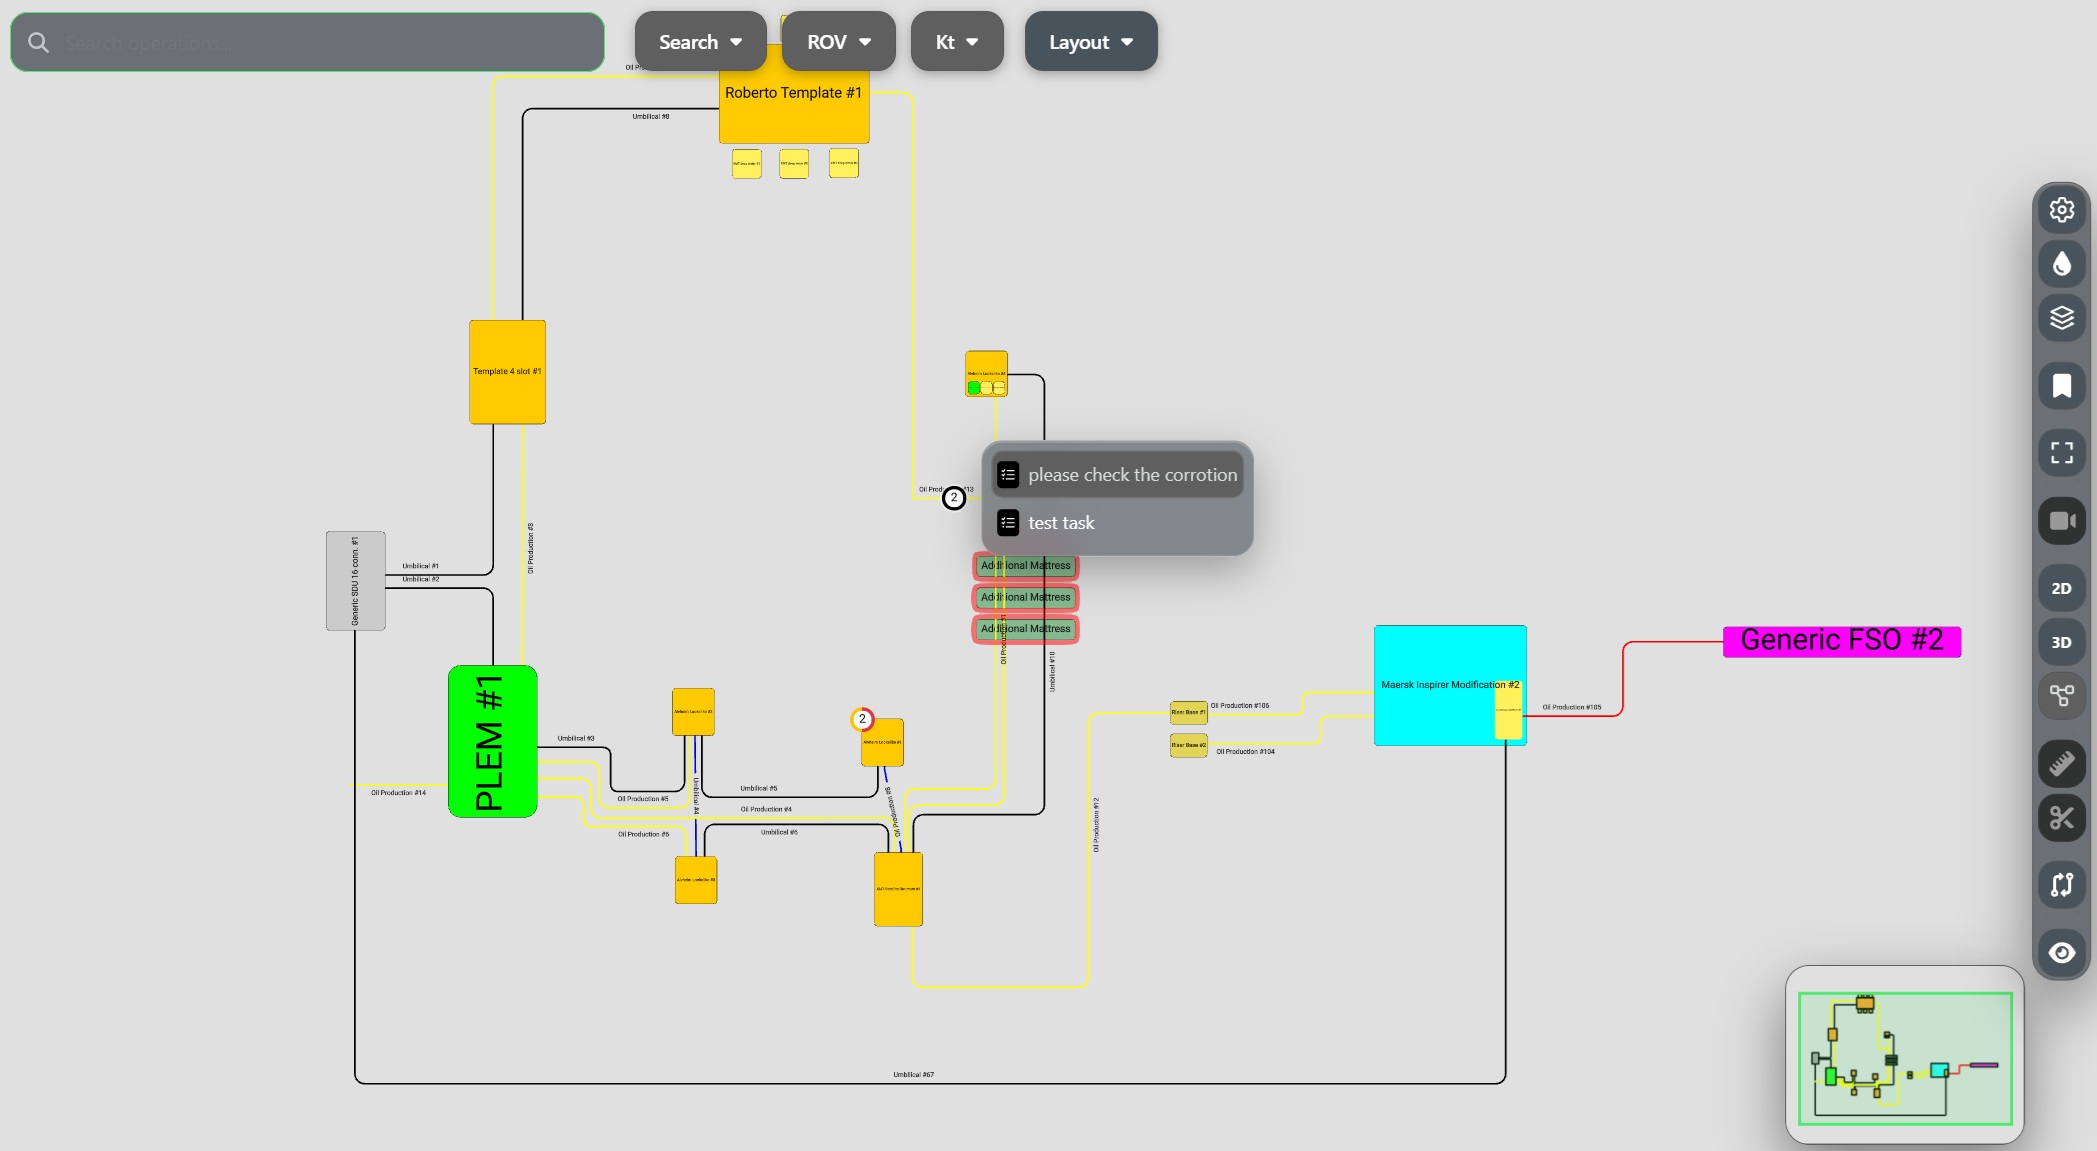
In the schematic view you can zoom and pan as you would in 2D view. You can also use the birds eye window for large schematics or when zoomed far into the schematic to help you navigate around by again using the mouse for panning or the mouse scroll wheel as shown below:
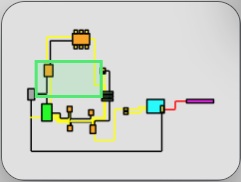
And of course, objects and annotations are clickable as information objects.
Measure
Enables the measurement tool that allows you to measure the distance in the selected unit system and view the angle between 2 selected points in the stage. The measurement function will stay active until you select the "Clear Ruler" icon. To start a new measurement, simply click on a new point you want to measure from. The radius can be determined for e.g. ships or installations for different purposes such as safety distance.
You can use the measure tool independently in any 2D or 3D Viewport window. If you measure in 3D mode, we will also display the height when you move the mouse along the Z axis after completing the measurement circle as shown below:
Press the X icon that is now showing just below the measure tool to cancel the measure functionality.
3 Point Angle Measurement
Enables the 3-point angle measurement tool that allows you to measure the angle in degrees by selecting three (3) points in the viewport. The measurement function will stay active until you select the "Clear Ruler" icon. To start a new measurement, simply click on a new point you want to measure from.
Clip Plane
This will enable the clip plane functionality in 3D mode and show the clip plane with controls in the viewport as shown below:
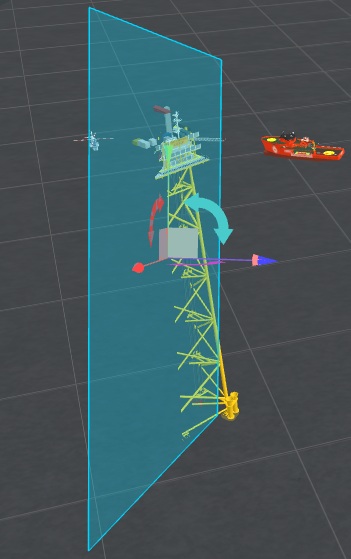
The toolbar will also expand with additional clip plane tool functionality:
| Command | Description |
|---|---|
 |
Set the clip plane in X axis mode |
 |
Set the clip plane in Y axis mode |
 |
Set the clip plane in Z axis mode |
 |
Set the clip plane in rotate axis mode |
 |
Cancel Clip Plane |
The Clip Plane Movement controls:
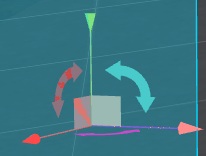
These controls allow rotation and movement on all axis in 3D space. Click and hold down on the desired movement or rotation part of the clip control to manipulate the clip plane. In short;
Yaw – Rotation around the vertical (Z) axis; turns the clip plane left or right. Pitch – Rotation around the lateral (Y) axis; tilts the clip plane up or down. Roll – Rotation around the longitudinal (X) axis; rotates the clip plane side-to-side.
Point Cloud Compare

This will display the dialog for the Point Cloud Comparison Tool that allows you to compare point clouds from inspections of an asset or pipeline and detect any changes over time. This can be useful to detect the dangers of scouring for subsea assets or pipelines.
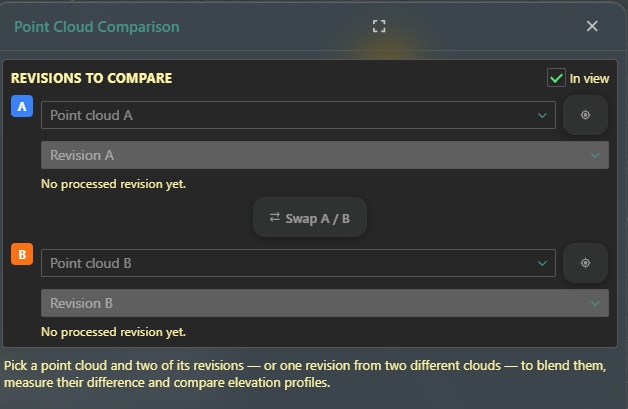
See the following Point Cloud Comparison for more information!
Hide/Show distant annotations
Selecting this function will hide annotations in the distance as you typically will have a lot of them in an operate scenario and when you zoom in for more detail.
Help
Selecting this function will allow you to launch the built-in documentation in a seperate window.
Bottom Command Bar
At the bottom of the Viewport, you will find the following functionality and information.
Visibility
Use the following button to control the visibility of objects:
to display the following dialog that will list the hidden objects by your user settings, or allows you to search for items to hide by name:
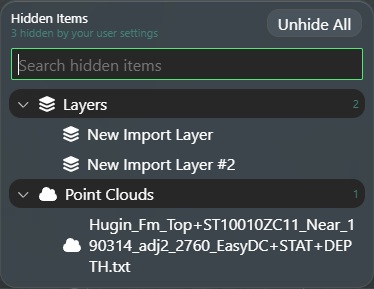
Restore All - Press this to revert all objects to visible.
Search - Start typing to search for any object in the project and list them.
Preview - Click this button to preview the matches before hiding them.
Hide - Click this button to hide the matching objects.
Coordinate Info
Positioned in the lower right corner of the viewport you will find the coordinate info and current EPSG for the operate project:

X - Shows the current x coordinate of your mouse pointer position.
Y - Shows the current Y coordinate of your mouse pointer position.
Z - Shows the current depth of where your mouse pointer position is.
Copy Coordinates - If you click on any of the coordinates shown the X,Y,Z coordinates will be copied to the clipboard.
ESPG - Shows the selected ESPG for the current operate project.
 - If you position your mouse over the i icon the tooltip will display information on the ESPG selected.
Asset Commands
You can interact with assets or objects if you will such as subsea structures, topsides, pipelines, cables, wells etc. in the viewport by right clicking on them to display the respective object menu as shown below:
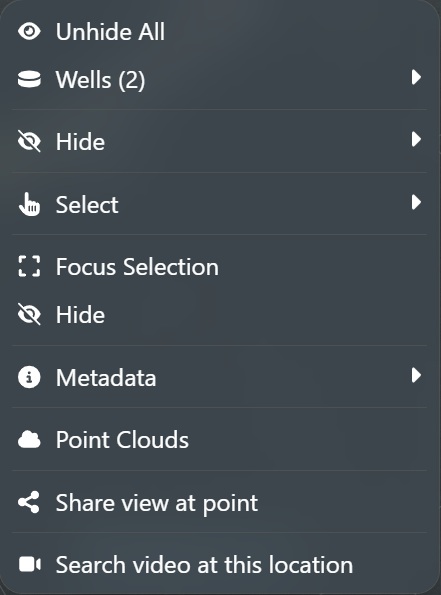
The available commands shown depend on the asset/object selected so not all commands will always be available. The commands are as follows:
Hide
This will hide the selected object.
Hide under Cursor
This will display a list of the objects under the cursor or selected object if you will. Select one to hide it!
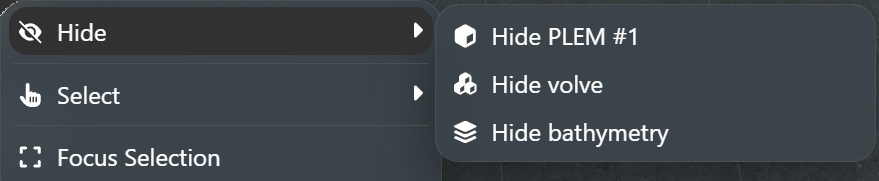
The right-click menu will then have entries for Asset, Pipeline, Wells displaying the number of hidden items.
Select
Select this to display a list of the connected objects to the asset and then click on the desired one to select it.
Focus Selection
Zooms into the selected object to bring it into focus.
Metadata
Select this to display the following menu with Metadata options:
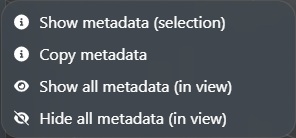
Show metadata (selection) - Displays a dialog with all metadata for the selected object.
Copy metadata - Copies the metadata to the clipboard.
Show all metadata (in view) - Displays dialogs with all metadata for all objects visible in the viewport.
Hide all metadata (in view) - Hides all metadata dialogs shown for the current viewport view.
Point Clouds
Select this to display the following menu with the available point clouds for the project:
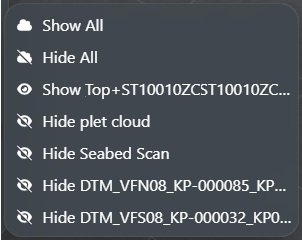
Show All - Displays all project point clouds.
Hide All - Hides all project point clouds.
Then you will see the individual point clouds listed with options to Hide or Show depending on their current visibility.
Share view at point
Creates a viewpoint URL with the current stage view (position) that can be shared given that the recipient has access to FieldTwin Operate for this project.
Search video at this location
This will query the FieldTwin Vision (ROV) integration for any videos that are at this location and display the results if any as shown here:
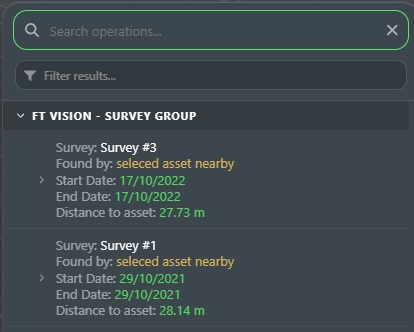
Select a result and you will launch FieldTwin Vision to view the video.