The numbers look wrong
Check these three things, in this order
Coverage. Volumes only describe the part of your area that both surveys covered. At 40% coverage, the number describes 40% of what you drew. See Measure how much moved.
Direction. Everything is B minus A. If deposition and erosion look swapped, the surveys are in the wrong slots - press Swap A / B and recompute.
Registration. Draw a profile line across ground that definitely did not change. If the two curves are offset there, the two surveys disagree about the datum, and that offset is baked into every volume.
Other likely explanations:
| What you see | Why |
|---|---|
| Two identical surveys do not report exactly zero | No noise floor is applied - every difference counts, including survey noise. Judge significance against the noise you can see on unchanged ground. |
| High “slope of the difference” on flat seabed | Those maps describe how the change varies across space, not the steepness of the ground. |
| Coverage drops when the area includes the survey edge | The fringes of a survey are sparse and get dropped. Tighten the boundary. |
| A number changed after you nudged the boundary | Moving the shape makes it a different area, so the old result no longer applies. Compute again. |
| A pipe that moved sideways reads as a trench next to a ridge | Expected. The tool measures one height per cell, so it cannot represent a displaced vertical object. See the 2.5D note. |
Difference map failed
The panel shows the reason in red:
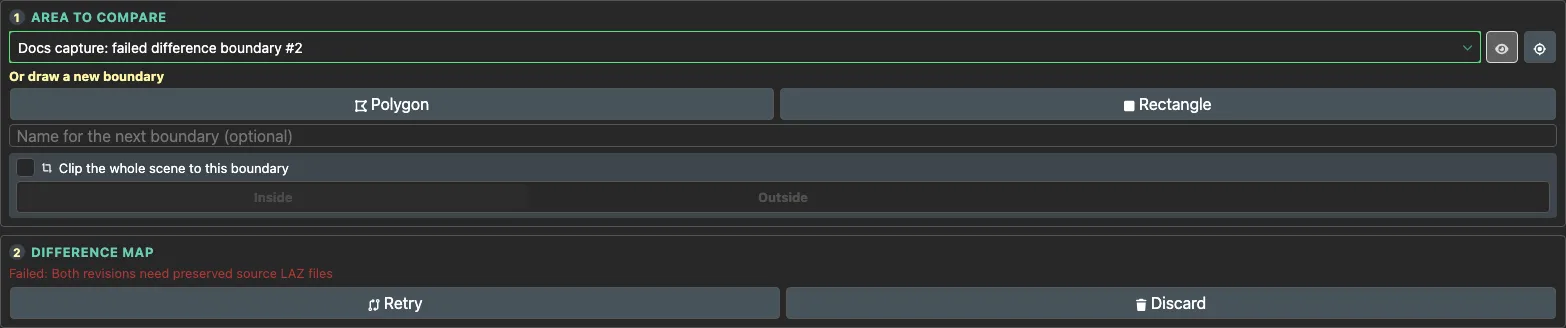 The Difference tab showing Failed: Both revisions need preserved source LAZ files, with Retry and Discard
| Message | What to do |
|---|---|
| Both revisions need preserved source LAZ files | One survey was imported before original files were kept. Re-import that survey; there is no other fix. |
| Both revisions must be fully processed | Wait for the import to finish, then try again. |
| One or both revisions not found | A survey was deleted after you pressed the button. Pick surveys that still exist. |
| Boundary shape does not overlap the selected point cloud revisions | Your area is not over the data. Move or redraw it. |
| A boundary shape is required to compute the diff | Reselect the boundary and try again. |
| Upload failed: … | A storage problem on the server. Retry; if it persists, this one is for support. |
A job that looks stuck
Building the grids for a dense survey is genuinely slow, and the bar only moves when the underlying tool reports progress. If the step name still says Generating DEM for revision A/B, it is working.
Coverage is 0%
Step 3 reporting 0 percent coverage and zero volumes
 The message reads “0 of 17,635 cells are observable in both revisions”, and every volume is zero.
The comparison ran fine - it just found no cell that both surveys could see. Almost always this means the boundary sits where the two surveys do not overlap. Two survey lines that appear to cross in a perspective view often do not overlap at all on the ground.
Switch the 3D view to 2D (top-down), look at where the two surveys genuinely overlap, and draw the boundary there.
Nothing appears in the pickers
Common reasons are:
| Message | What to do |
|---|---|
| No point cloud in the current view. Move the viewport, or turn off “In view”. | Untick In view. |
| No point cloud in this project. | Import a survey first. |
| No processed revision yet. | The survey is still converting, or its import failed. |
| Only one comparable revision. | Pick a second point cloud for the other slot. |
| Pick two different revisions to compare them. | Both slots ended up on the same survey. |
The fade will not load
| Message | What to do |
|---|---|
| Selected revisions are missing point cloud metadata. | That survey’s conversion did not complete. Re-import it. |
| Failed to load one or more revisions. Make sure processing is complete. | The survey says it is ready but its files are unreachable - one for support. |
| Blending the timeline needs at least two processed revisions. | Point cloud A has only one usable survey. Use A vs B. |
Map / Mesh does not appear
| What you see | Why |
|---|---|
| The map checkbox is greyed out That map does not exist on this result. Pick another Map values, or Recompute - older results predate the slope, ruggedness and roughness maps. | |
| Volume mesh is greyed out | The volume has not been computed yet. Wait, or reselect the boundary. |
| The map is all one colour | The display range is clamped far outside the data. Open Map colours & range and widen it. |
| Big transparent patches | Those cells are not covered by both surveys. Expected - check coverage. |
| The overlay is hidden behind the survey points | Set Point cloud to Dim or Hide. |
| Show / Dim / Hide is greyed out | Turn on an overlay first. |
Empty profile chart
| Message | What to do |
|---|---|
| One of the two revisions has no elevation raster yet. | Compute a difference map for this pair - it fills in the missing raster - or re-import the survey. |
| No valid elevation data found along this line. | The line misses the surveys. Redraw it over the data. |
| Gaps in a curve | That survey has no data there. Expected. |
What the tool cannot do
These are design limits, not faults. Knowing them saves a lot of time.
| Limit | What it means for you |
|---|---|
| One height per grid cell (2.5D) | Vertical faces, overhangs, pipe sides and structure walls are not measured as surfaces. |
| A boundary is required | There is no “compare the whole survey” button. |
| Both surveys need their original file kept | Older imports cannot be differenced without re-importing. |
| Boundaries can only be polygons or rectangles | Trace circles and rings as polygons. |
| Scene clipping needs a simple convex boundary | Complex shapes still work for the comparison, just not for clipping the view. |
| Timeline reads point cloud | A only Surveys imported as separate point clouds have no timeline. |
| The volume mesh is simplified | Its shape is approximate; read volumes from the numbers. |
| No noise threshold | Survey noise is included in the volumes. |
| Area edges are accurate to about half a cell | Keep boundaries clear of the feature you are measuring. |
| You cannot compare a difference against another difference | Intentional - the result would not be interpretable. |
| A successful map can be recomputed but not deleted | Recompute replaces it. Deleting its boundary shape simply hides it from the panel. |
Two comparisons at once
Opening a second Point Cloud Comparison panel is supported and is the intended way to compare two pairs side by side. Each panel keeps its own selections, its own map and its own measurements.